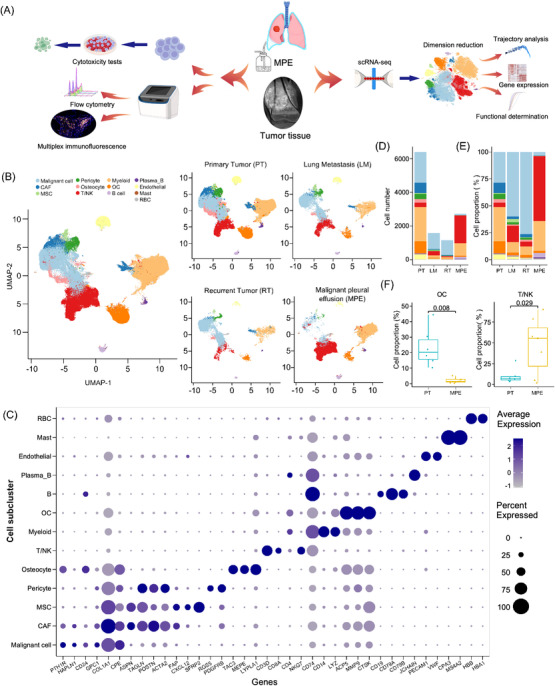
FIGURE 1.

Landscape of cell clusters in tumour and MPE samples of osteosarcoma patients delineated by scRNA‐seq analysis. (A) Workflow of our study design. Eight tumour tissues and seven MPE samples from individual patients were performed for the scRNA‐seq analysis, and two other MPE samples were collected for cellular cytotoxic and flow cytometry tests in the current study. (B) The UMAP plots demonstrate the 13 mainly identified cell clusters in all OS patients or from different sample types. (C) Dotplot exhibits the expression levels of canonical markers in each cell cluster. Cell number (D) and (E) proportion of assigned cell clusters in different sample types were demonstrated. (F) The bar plot presented the relative proportion of OC and T/NK cells among immune cells (CD45+) between primary tumour and MPE samples. A comparison of the cellular proportion between the groups was performed using the Wilcoxon test.
