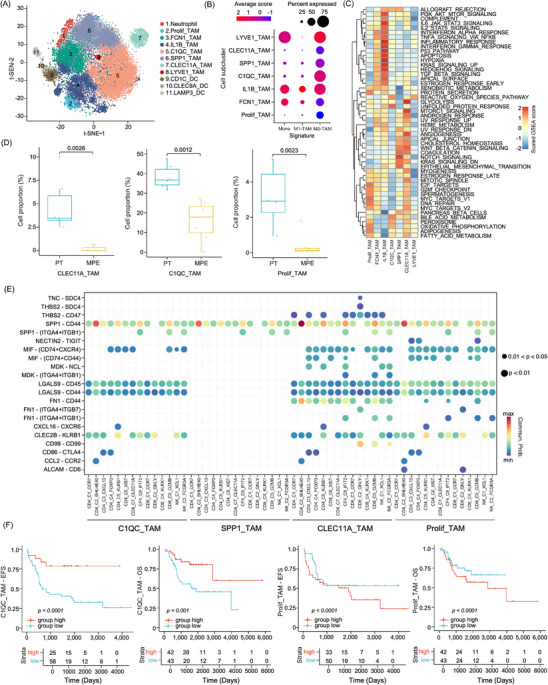
FIGURE 4.

Diversity of myeloid cells in the osteosarcoma tumour microenvironment. (A) t‐SNE plot showed the 11 major sub‐clusters of myeloid cells. (B) Dot plot displayed monocyte, M1‐ and M2‐type tumour‐associated macrophage (TAM) gene signature scores in each myeloid cell type. (C) Heatmap showed the enriched hallmark gene signatures in TAM sub‐clusters. (D) Box plots presented the differences in selected TAM proportions between MPE and primary tumour (PT) samples. (E) Dotplot showed the significant ligand–receptor interactions of selected TAM sub‐clusters with T/NK sub‐clusters in PT tissues. (F) The Kaplan–Meier plot demonstrated event‐free survival (EFS) and overall survival (OS) curves of TARGET‐osteosarcoma patients according to C1QC_TAM and Prolif_TAM gene signature scores. Comparisons between groups were performed using the two‐sided log‐rank test.
