
FIGURE 6.
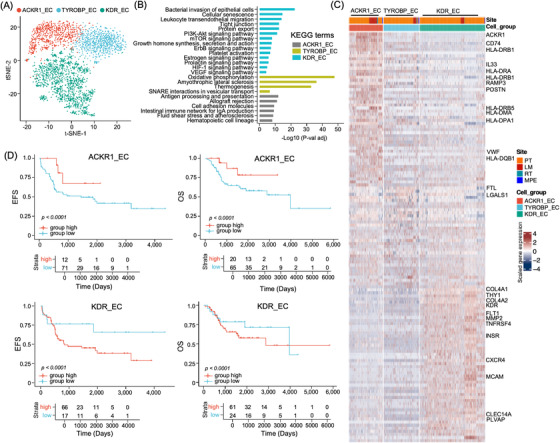
Dissection and clustering of endothelial cells (ECs) in osteosarcoma TME. (A) The t‐SNE plot showed the EC sub‐clusters in osteosarcoma TME as coloured labelled. (B) The bar plots displayed the KEGG enrichment analysis results of genes over‐expressed in indicated DC sub‐clusters compared to other sub‐clusters. (C) Heatmap presented the normalized expression of differentially expressed genes in each sub‐cluster. (D) The Kaplan–Meier curves demonstrated event‐free survival (EFS) and overall survival (OS) in the TARGET‐osteosarcoma patients cohort according to ACKR1_EC and KDR_EC gene signature. The x‐axis represents time (days) and the y‐axis represents survival probability. Comparison between the curves was performed using the log‐rank tests.