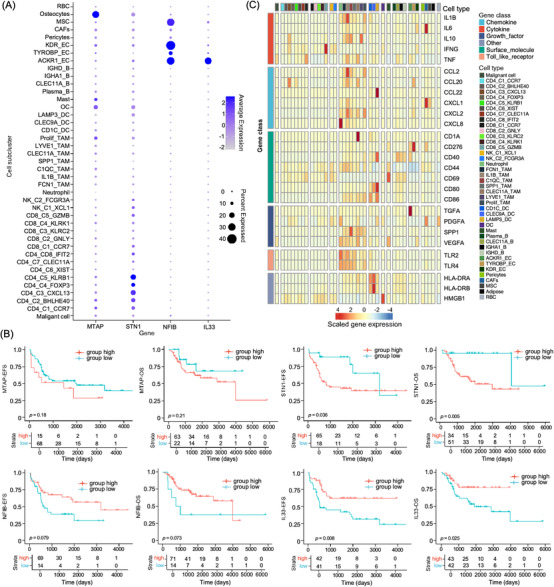
FIGURE 7.

Cellular sub‐cluster‐specific expression patterns of genes related to osteosarcoma susceptibility, prognosis and MPE formation. (A) The dot plot displayed the expression of MTAP, STN1, NFIB and IL33 genes in cellular sub‐clusters from primary tumour tissues of osteosarcoma patients. (B) The Kaplan–Meier curves demonstrated event‐free survival (EFS) and overall survival (OS) in TARGET‐osteosarcoma patients with different expression levels of MTAP, STN1, NFIB and IL33 mRNA. The x‐axis represents time (days) and the y‐axis represents survival probability. (C) The heatmap presented the average expression levels of genes in each cell sub‐cluster related to MPE formation.
