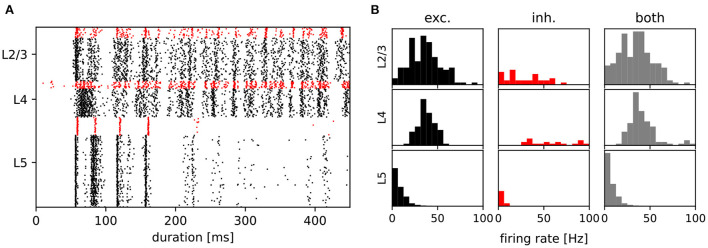
Figure 4.
Activity of the data-based circuit. (A) Raster plot for the data-based circuit after input stream two was activated at 100 ms. Excitatory neurons are black and inhibitory neurons are red. (B) The corresponding firing rate histograms for each population and layer. C.f. Figures 2B,C, original publication (Häusler and Maass, 2007).

