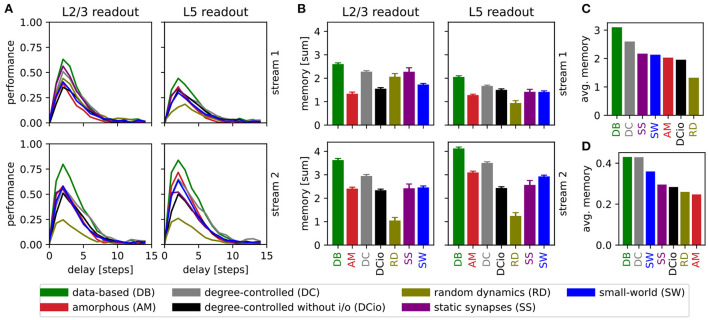
Figure 8.
Results of retroactive spike pattern classification tasks for all network types. (A) Performances (kappa coefficient) for the classification of spike patterns with a duration of 5 ms at different delays, separated by input stream and readout (averaged over 40 trials). (B) Bars representing the sum of task performances over all delays for the same task as in (A). Error bars represent the standard error of mean. (C) Values from (B) averaged across all input streams and readouts. (D) Averaged results of the delayed classification of 30 ms spike patterns (data of memory row in Table 6).

