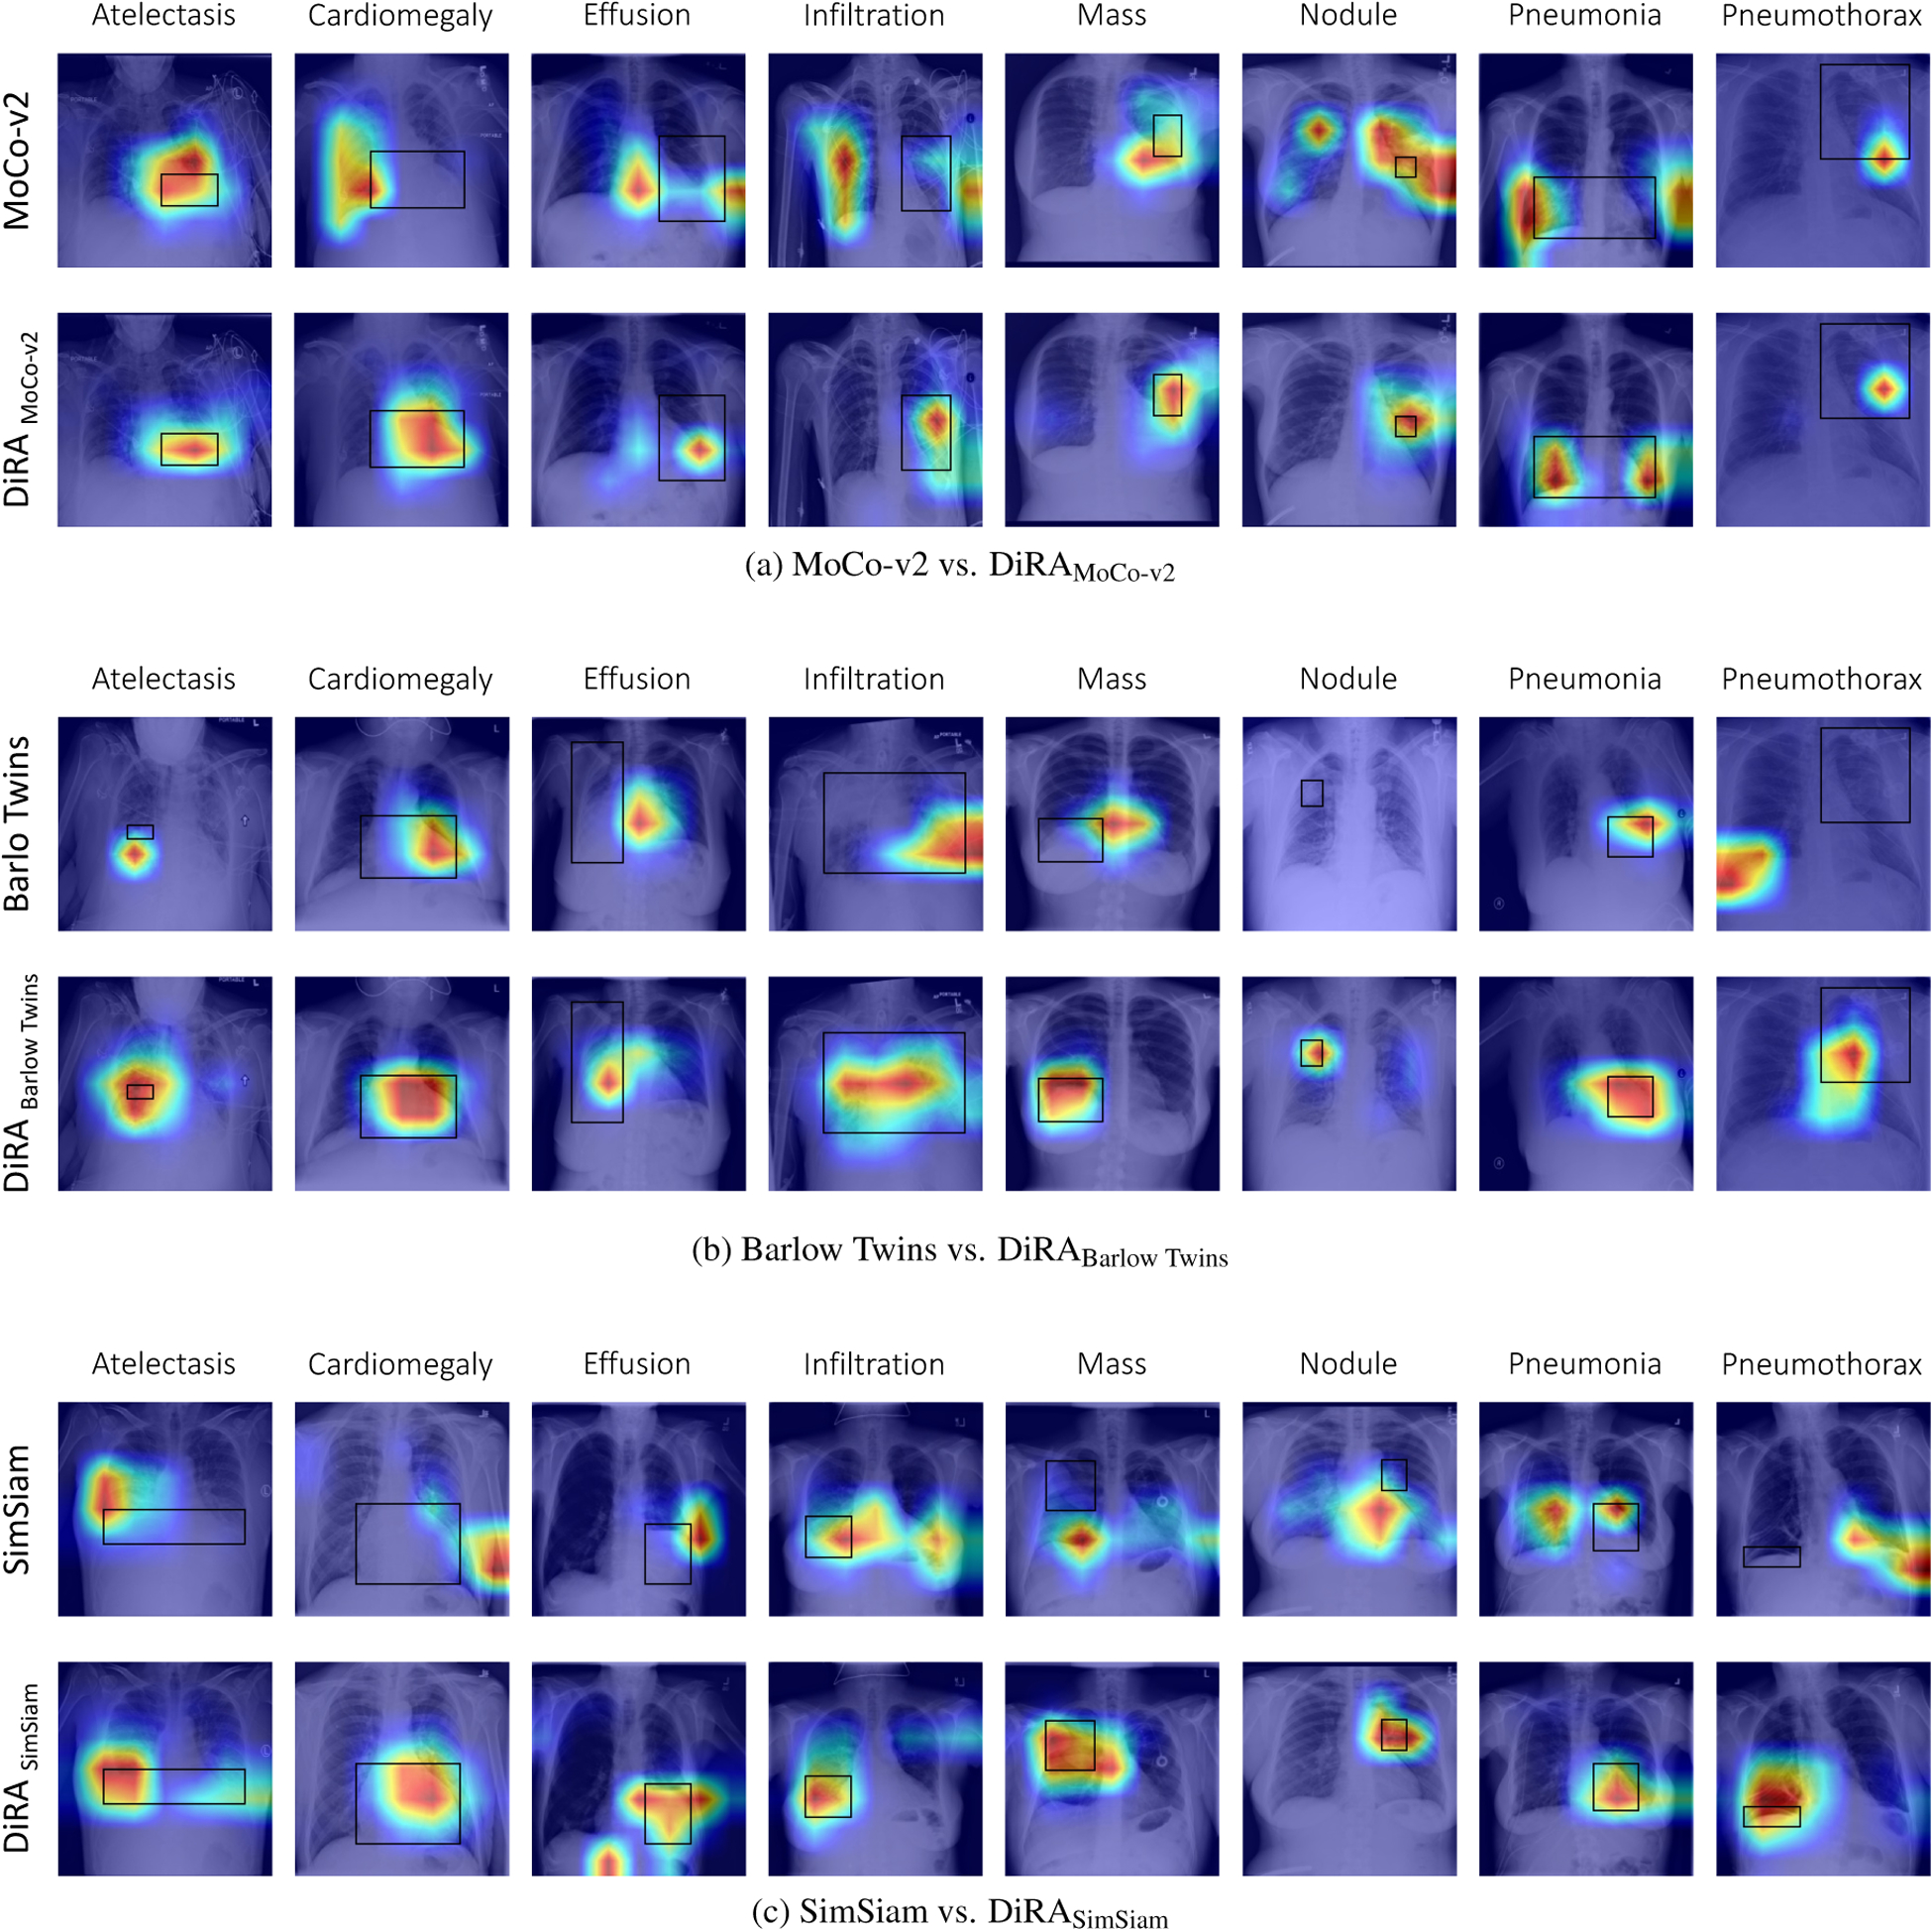
Figure 6. Visualization of Grad-CAM heatmaps:

We provide the heatmap examples for 8 thorax diseases in each column. The first row in each sub-figure represents the results for the original self-supervised method, while the second row represents the original method when adopted in DiRA framework. The black boxes represents the localization ground truths.
