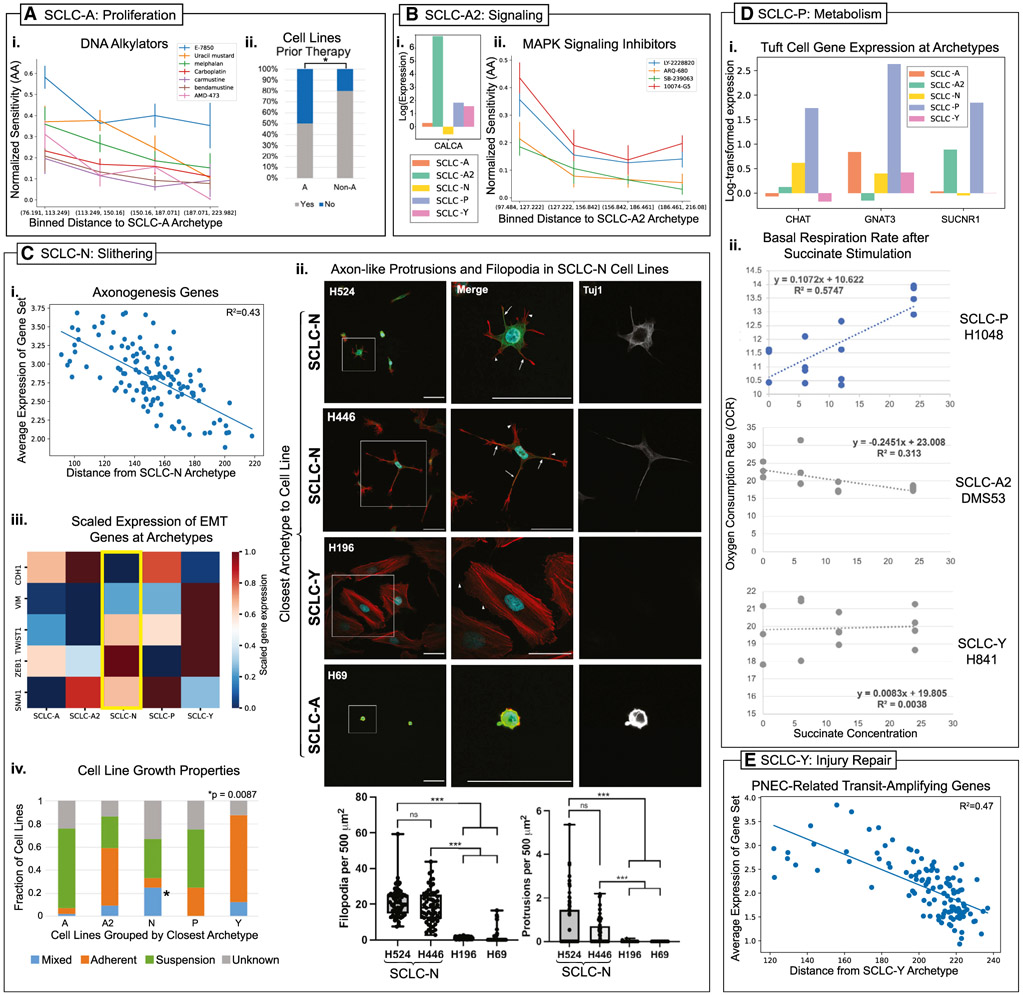
Figure 2. SCLC cell line archetypes optimize PNEC-related tasks.
(A) SCLC-A is enriched for proliferation.
(i) Normalized activity area (AA, a measure of sensitivity) to DNA alkylators. Cell lines in the bin closest to the SCLC-A archetype are more sensitive (p < 0.05). Error bars show standard error of the mean (SEM) of AA for cell lines in each bin by distance.
(ii) Cell lines closest to A are less likely to have had prior therapy (p = 0.019, hypergeometric test).
(B) SCLC-A2 is enriched for signaling.
(i) CALCA expression is highest at the SCLC-A2 archetype.
(ii) Cell lines closest to SCLC-A2 are most sensitive to MAPK signaling inhibitors (p < 0.05). Error bars show SEM for cell lines in bin.
(C) SCLC-N is enriched for slithering-related tasks.
(i) Average expression of an axonogenesis gene set from Yang et al. (2019) as a function of distance from the SCLC-N archetype, showing a correlation between expression and closeness to the SCLC-N archetype.
(ii) Axon-like (Tuj1+) protrusions and filopodia are more prevalent in SCLC-N cell lines, as shown by arrows (Tuj1+ protrusions) and arrowheads (filopodia) and quantified using a one-way ANOVA (***p < 0.001, n = 3 replicates, 20 cells quantified per replicate). All scale bars are 50 mm. A representative of 6, 9, 9, and 2 individual cells are shown for four cell lines (left column), with a higher resolution image of a single representative cell shown for each cell line (middle and right column). DAPI channel for H69, H524, and H196 is brightened in the final images and no other digital adjustments were made.
(iii) EMT gene expression rescaled by gene (rescaled log-normalized expression) is shown by color in a heat map across archetypes. SCLC-N cells express some mesenchymal markers (ZEB1, SNAI1, and TWIST1) at intermediate levels and downregulate CDH1.
(iv) SCLC-N cell lines are more likely to be mixed (3/12 cell line) than non-N cell lines (3/80 cell lines) with p = 0.0087 (hypergeometric test).
(D) SCLC-P is enriched for tuft cell-like features and metabolism tasks.
(i) Genes upregulated in the SCLC-P archetype that is expressed in tuft cells. CHAT, GNAT3, and SUCNR1 are part of the pathway by which succinate stimulation affects the metabolism of intestinal tuft cells and the stimulation of type 2 immunity (Banerjee et al., 2020).
(ii) Basal respiration rate (OCR) after overnight (12 h) stimulation by succinate. H1048, which is closest to the SCLC-P archetype, increases OCR after stimulation, whereas SCLC-A2 and SCLC-Y cell lines do not.
(E) SCLC-Y is enriched in injury repair tasks. The average expression of genes related to the transit-amplifying subpopulation of PNEC stem cells from Ouadah et al. (2019) under lung injury is correlated with closeness to the SCLC-Y archetype.

