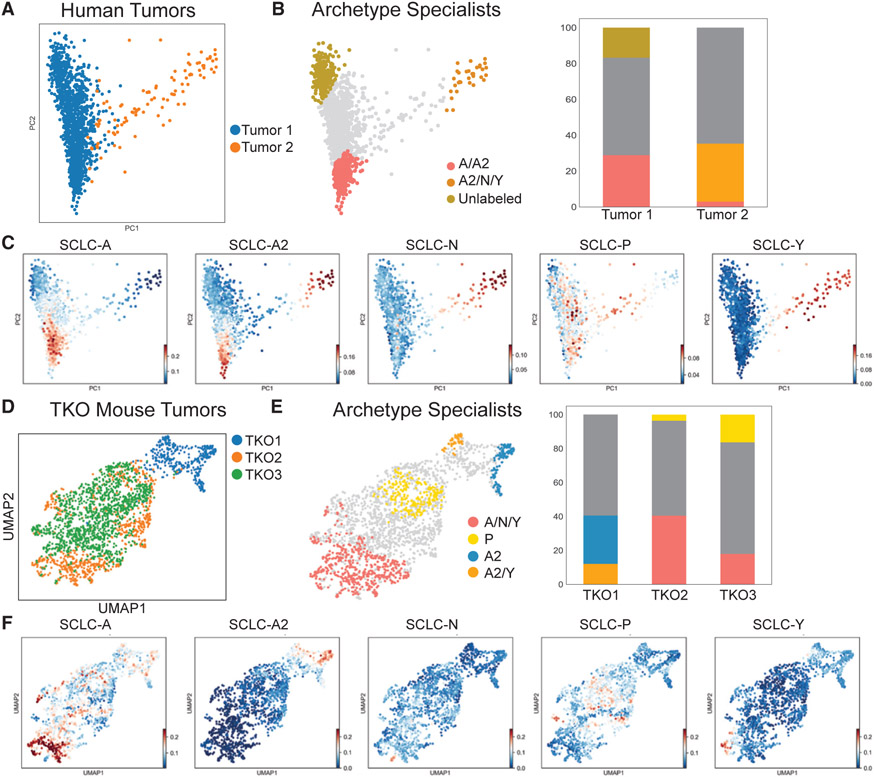
Figure 4. Archetype analysis of human tumors and triple knockout (TKO) mouse models.
(A) PCA of imputed scRNA-seq from two human tumors.
(B) Two human tumors shown in PCA with archetype specialists labeled. Three archetypes best fit the data. Specialists with scores > 0.9 are shown on the PCA projection. Bar plots show the proportions of specialists and generalists in each tumor.
(C) Bulk archetype scores used to label specialists in (B).
(D) Three TKO mouse tumors in a UMAP projection (GSE137749). TKO2 and TKO3 are from the same mouse, contributing to their overlap in the UMAP.
(E) Four archetypes fit the three TKO tumors. Archetype specialists are shown by color; generalists are shown in gray. Bar plots show the proportions of specialists and generalists in each tumor.
(F) Bulk archetype scores used to label specialists in (E). Archetype signature scores shown by color (linear scale, arbitrary units).

