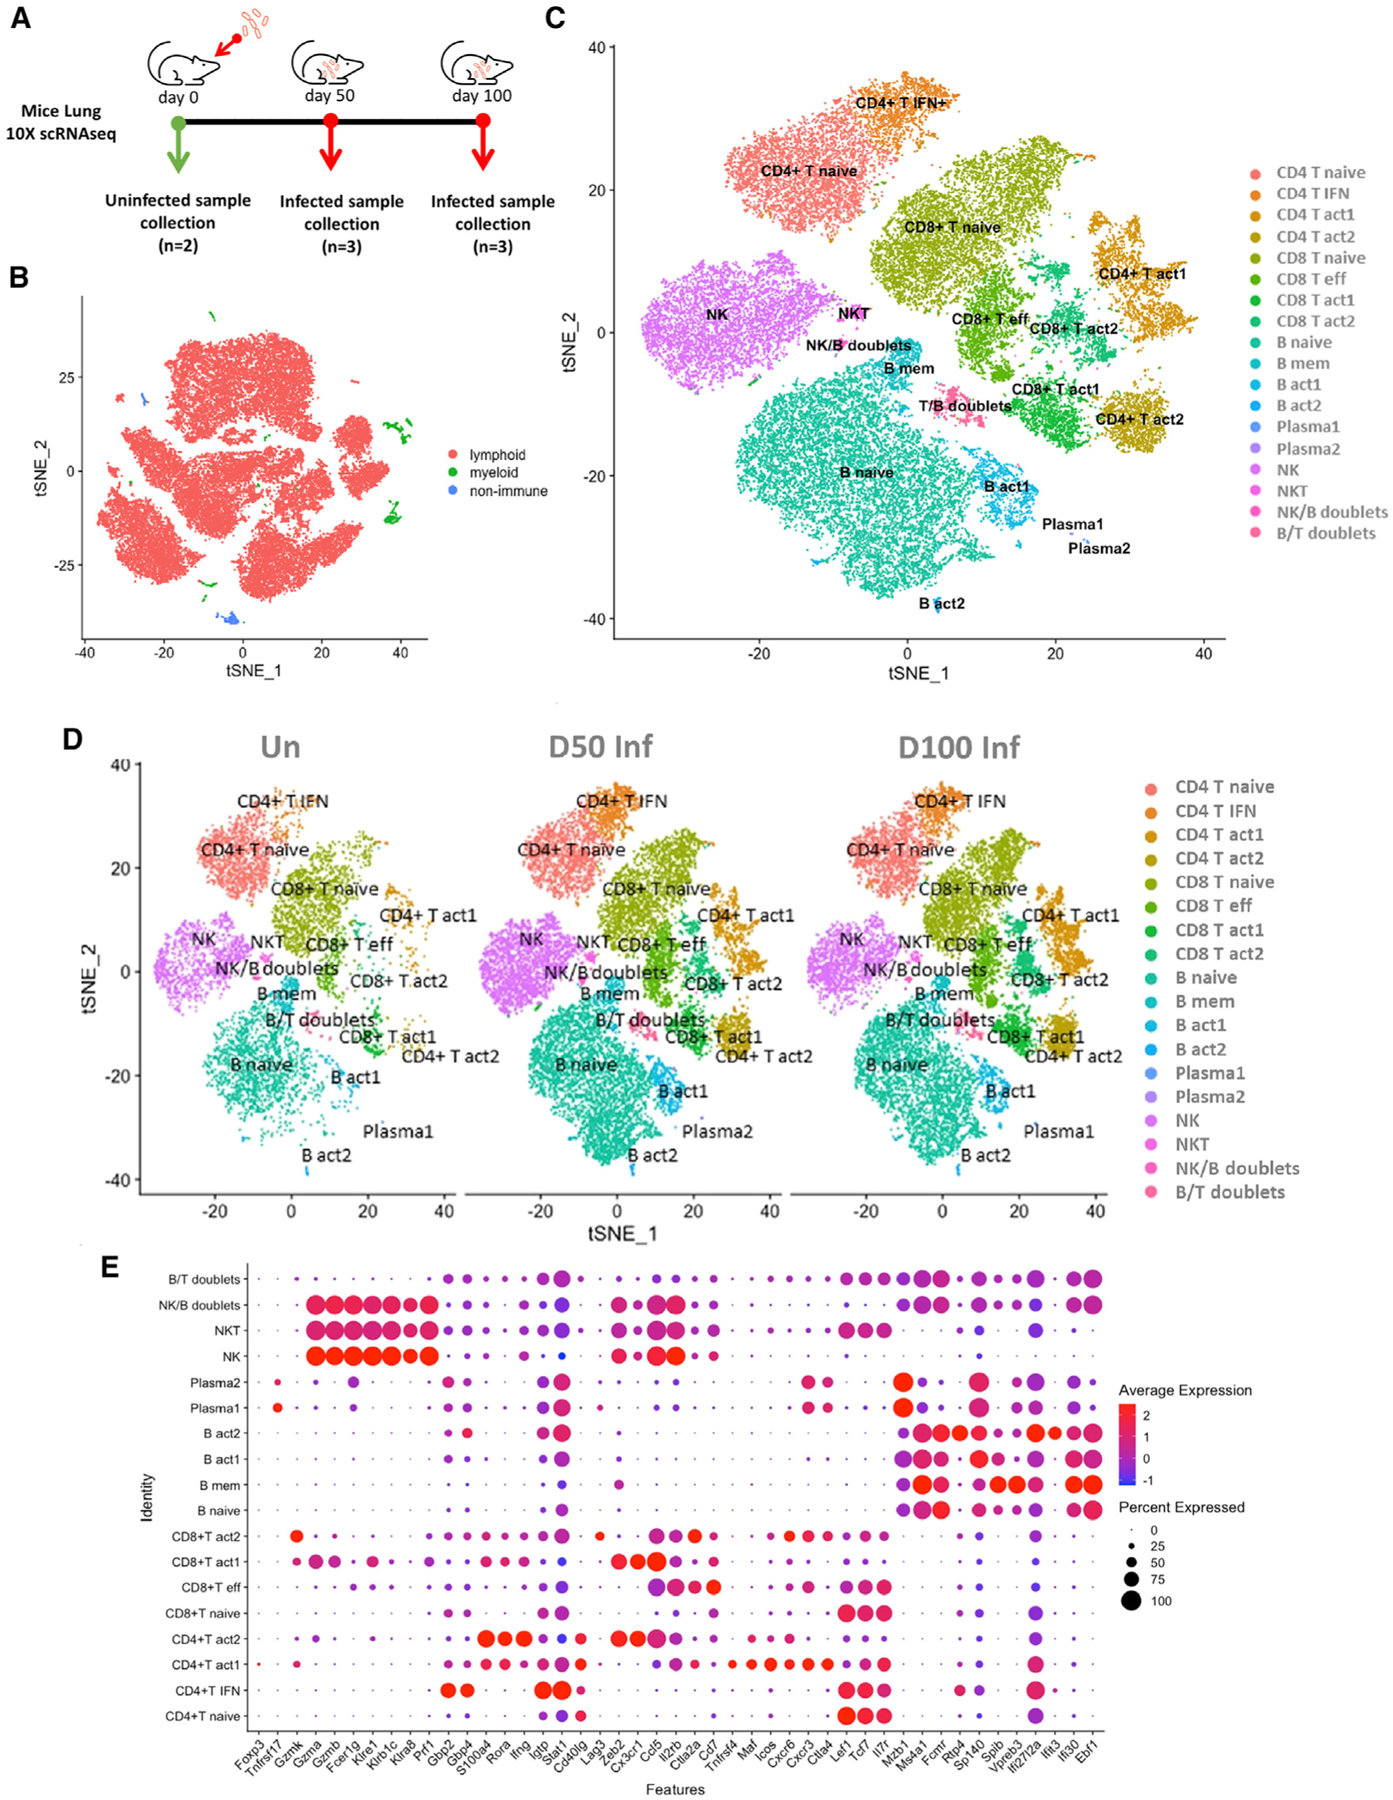
Figure 1. scRNA-seq transcriptional profiling of Mtb-infected murine lungs.

C57BL/6 mice were aerosol infected with Mtb HN878 and lungs were harvested at different dpi.
(A) Study design using 10x Genomics platform. For this study, single-cell suspensions from lungs were derived from mice at 0, 50, and 100 dpi and subjected to downstream analysis as described in the Method details.
(B) t-Distributed stochastic neighbor embedding (tSNE) visualization of the major cell types representing non-immune/lymphoid/myeloid cells in the dataset (all conditions together).
(C) tSNE plot of cell subtypes after re-clustering the lymphoid cells, colored according to cellular identity (all conditions together).
(D) tSNE plot of cell subtypes after re-clustering the lymphoid cells, colored according to cellular identity, split by condition.
(E) Dot plot indicating expression of key genes detected for each cell subtype. The dot color represents the expression level, and the dot size represents the percentage of cells in each cluster expressing a particular gene.
See also Figures S1 and S2.
