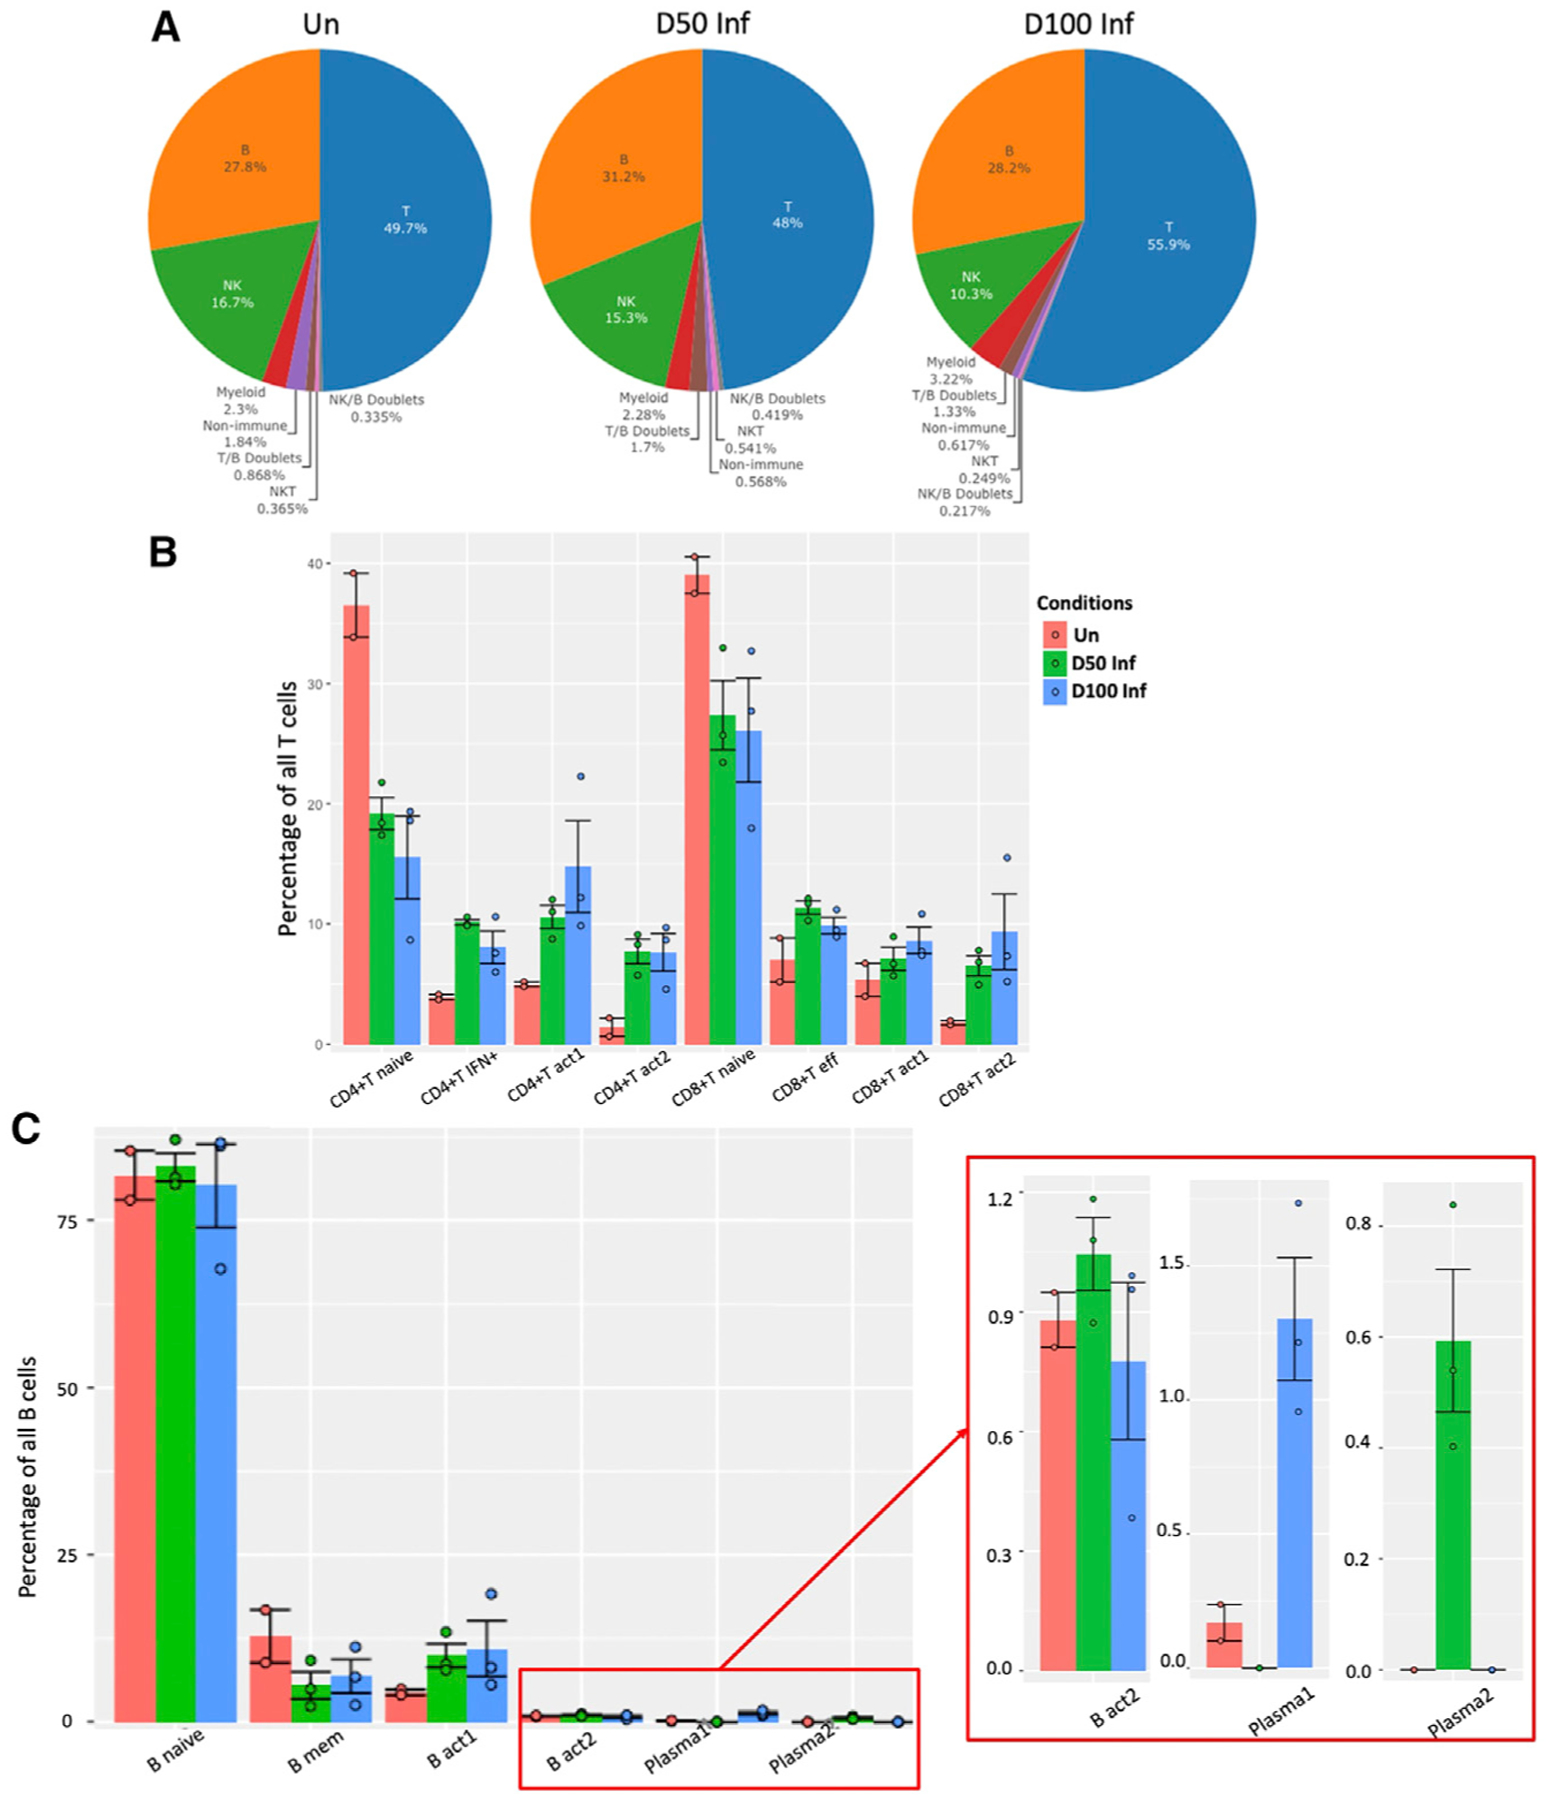
Figure 2. Lymphoid clusters accumulate in the lungs during acute and chronic Mtb infection.

(A) Pie charts representing the distribution of identified lymphoid cell types across conditions (0, 50, and 100 dpi).
(B) Distribution of T cell subsets by cluster per condition per sample.
(C) Distribution of B cells by cluster per condition per sample. Error bars are based on standard error of the mean. Wilcoxon rank-sum exact test was used to test whether the differences are significant among conditions in each cluster.
Un, n = 2; D50 Inf, n = 3; D100 Inf, n = 3.
*p < 0.05, **p < 0.01, ***p < 0.001.
