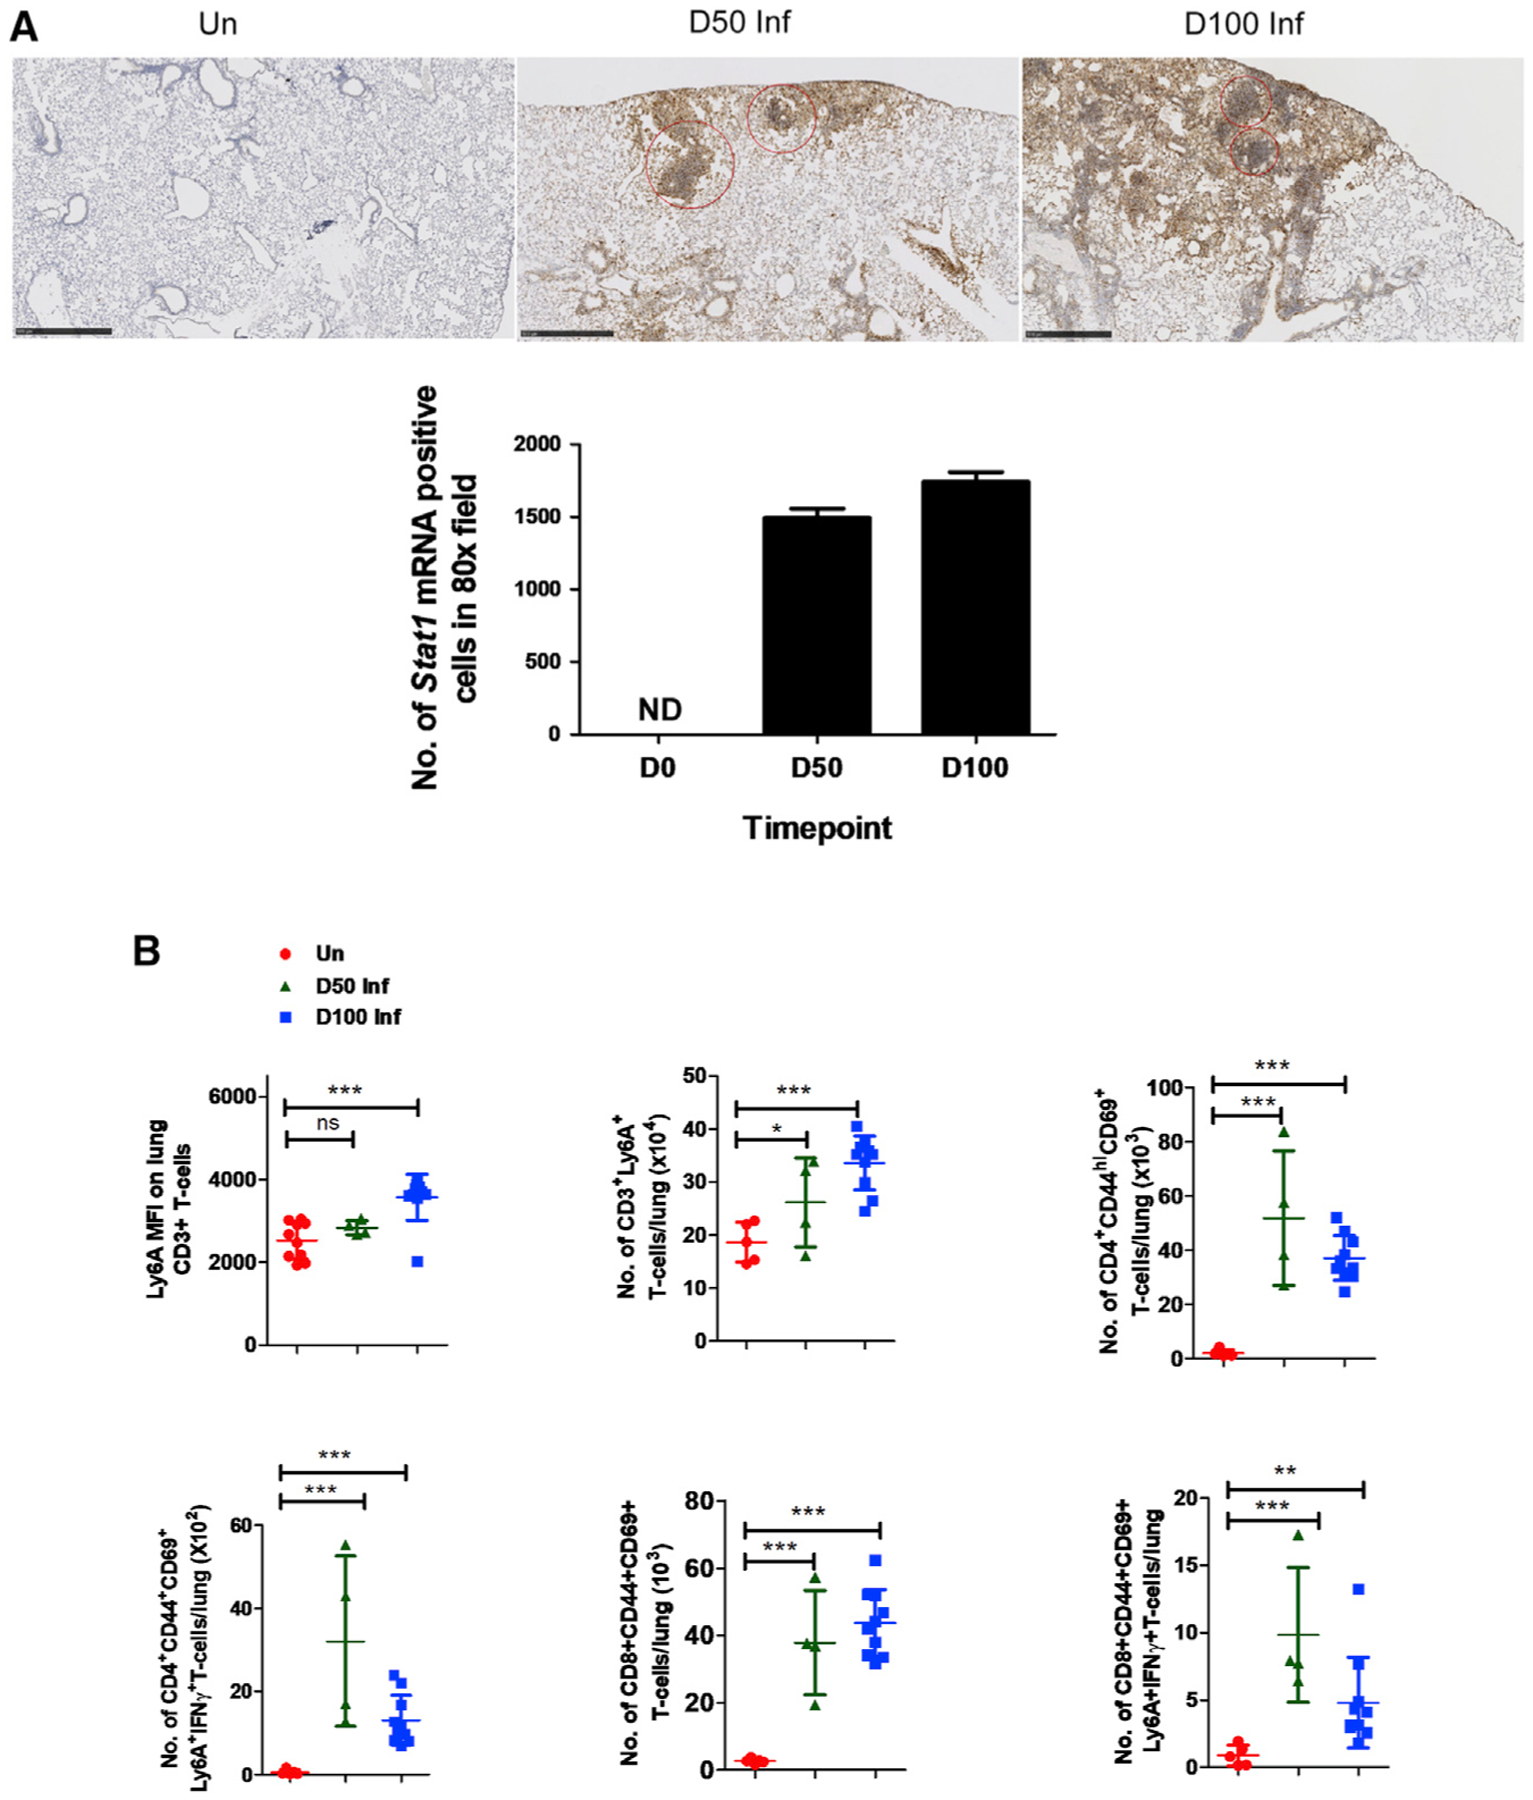
Figure 5. Induction of Stat1 and Ly6A expression in activated lymphoid cells in Mtb-infected lungs.

C57BL/6 mice were aerosol infected with Mtb HN878 and lungs were harvested at 0, 50, and 100 dpi.
(A) Histological analysis from paraffin-embedded sections from lungs of Mtb-infected mice showing induction of Stat1 mRNA using ISH (10×, upper panel) and its quantitations as number of Stat1 mRNA+ cells in 80× field (lower panel). ND, not detected. Red circles encompass regions with dense expression of Stat1 mRNA. Scale bar, 500 μM.
(B) Ly6A expression measured using flow cytometry among different effector lymphoid cell populations at 0, 50, and 100 dpi, as predicted by scRNA-seq analysis. Data points represent the mean ± SD values from 4 to 10 mice; significance assessed by Student’s t test. *p < 0.05, **p < 0.01, ***p < 0.001; ns, not significant.
