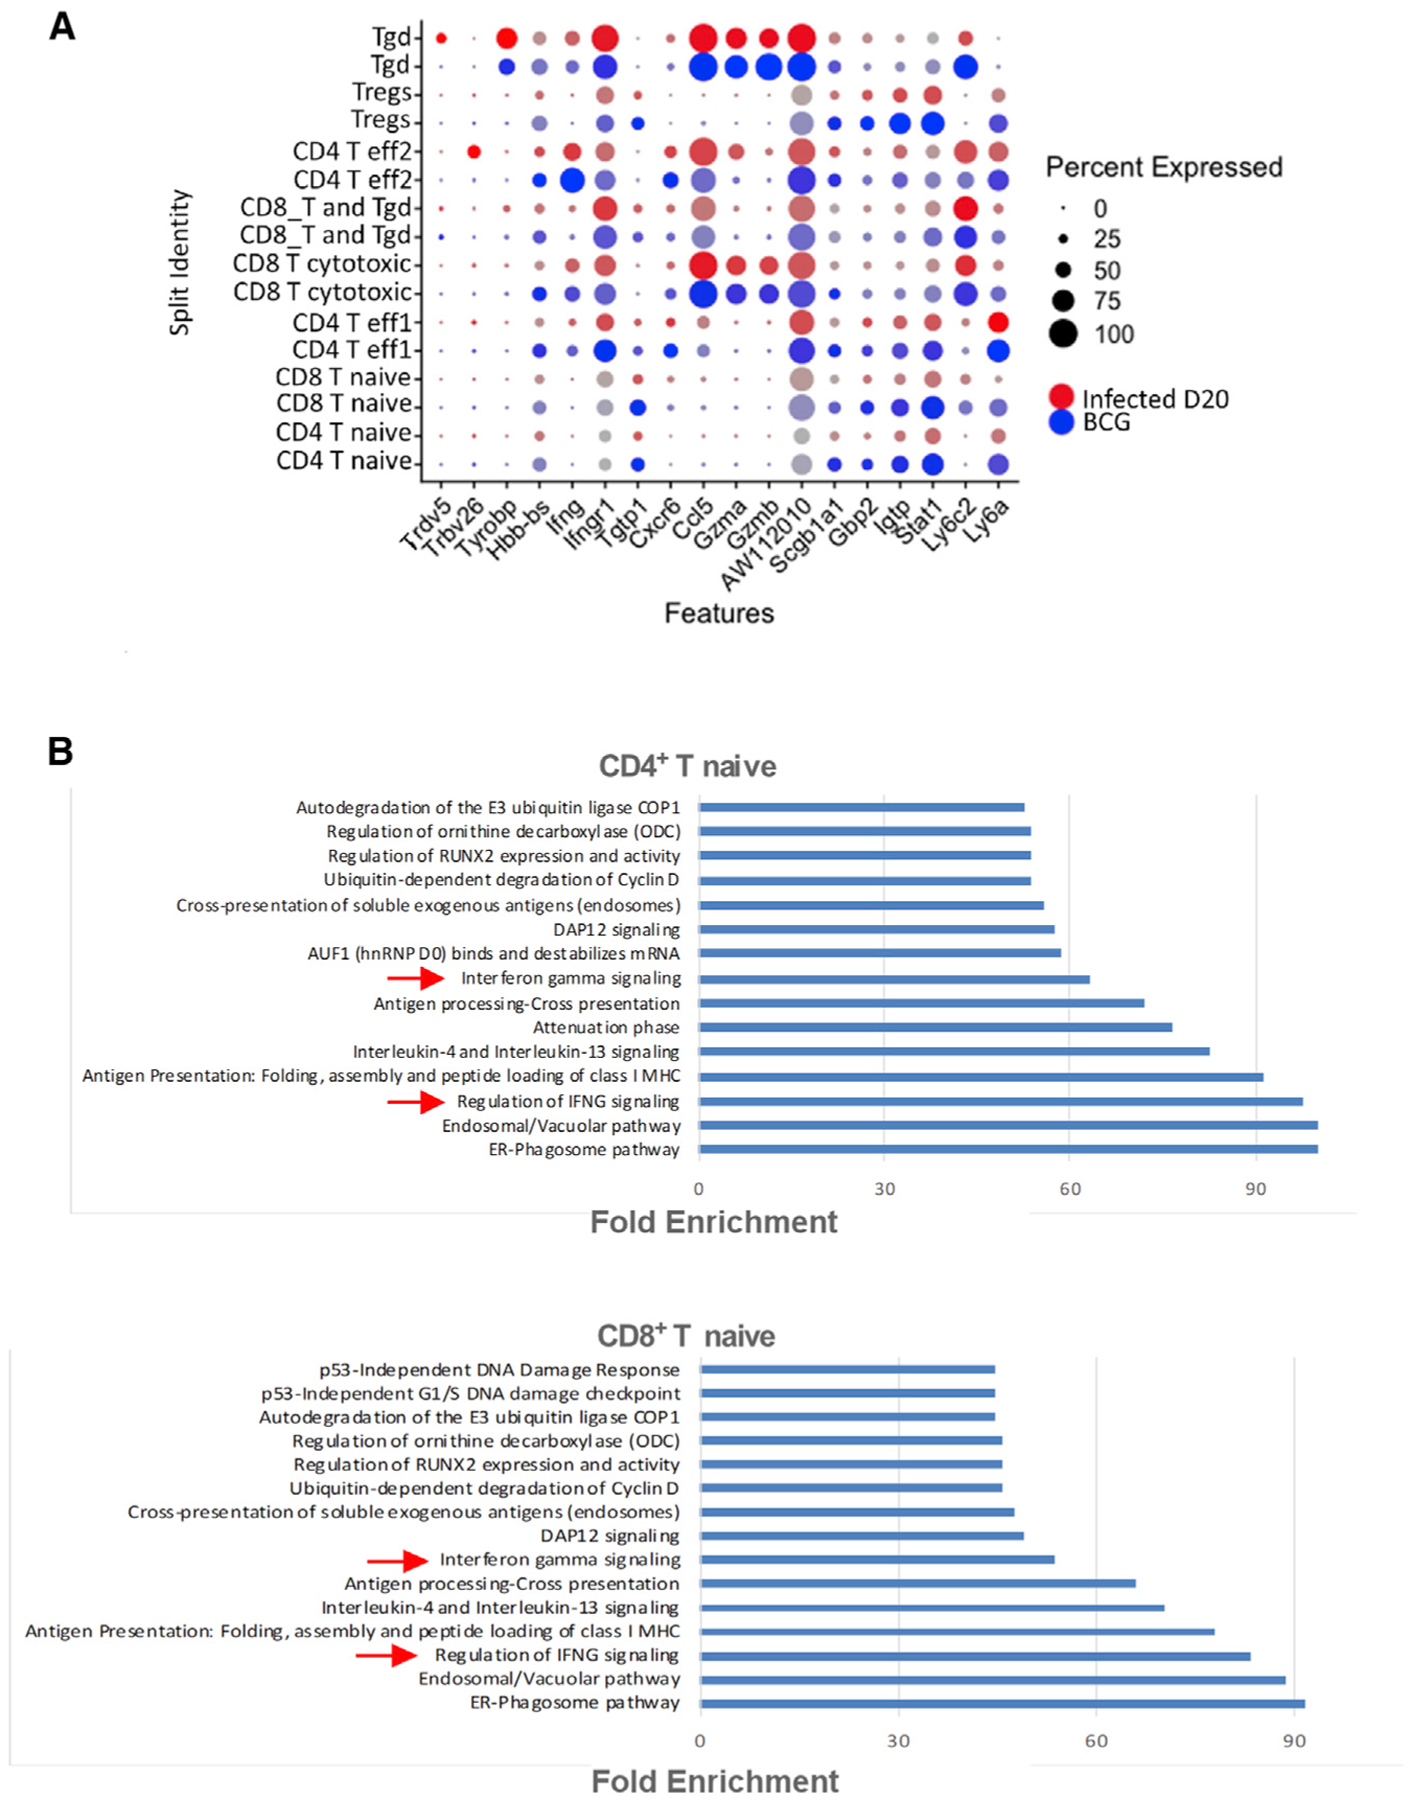
Figure 7. IFN-γ transcriptional pathways are upregulated in lung lymphoid clusters in BCG-vaccinated mice.

scRNA-seq was performed on lung single cells derived from BCG-vaccinated Mtb-infected mice at 15 dpi (n = 2) and compared to lungs of unvaccinated Mtb-infected mice at 20 dpi (n = 2).
(A) Dot plot represents the expression of top DEGs at different conditions in T cell clusters. The color of the dot represents the condition (red = unvaccinated infected, blue = BCG vaccinated infected).
(B) Top 15 significant overrepresented reactome pathways using the upregulated DEGs in BCG-vaccinated Mtb-infected lungs compared to unvaccinated Mtb-infected lungs in CD4+ T clusters. FDR <0.05.
