FIGURE 2.

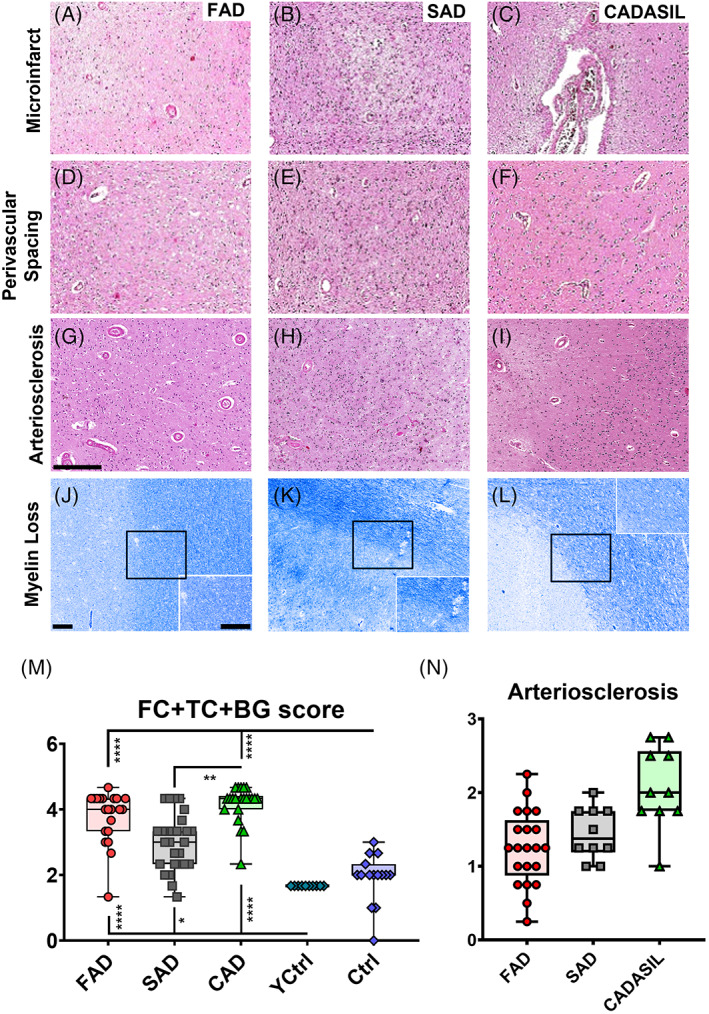
SVD pathology in PSEN1 p.Glu280Ala FAD, SAD and CADASIL. Representative images of vascular pathology are given for PSEN1 FAD, SAD and CADASIL (A–L), scale bar for all panels = 250 μm. The vascular features such as microinfarcts (A–C), perivascular spacing (D–F), arteriosclerosis (G–I) are shown in H&E staining and myelin loss (J–L) is shown in Luxol Fast Blue staining, all features shown in occipital cortex. The average score for frontal (FC) and temporal (TC) cortices and BG (L) was calculated to compare PSEN1 FAD cases with the SAD cohort (Colombian, SAD, n = 10, Newcastle, N‐SAD, n = 17) and different CADASIL mutations (Colombian CADASIL, n = 10, Newcastle CADASIL, n = 12), together with younger (Y‐Ctrl, n = 10) and older healthy (O‐Ctrl, n = 15) controls. Even though PSEN1 FAD tends to show wider variability of vascular pathology, average values are not significantly different to those from pure vascular dementia such as CADASIL. All groups show significant more vascular pathologies than both control groups (p values: **** ≤ 0.0001, *** ≤ 0.001, ** ≤ 0.01, * ≤ 0.05). SAD cases presented with significantly less vascular pathology than the CADASIL cases (p value: ** < 0.01) (M). The arteriosclerosis scores of the evaluated cortices are shown for PSEN1 FAD, SAD and CADASIL (N).
