FIGURE 5.

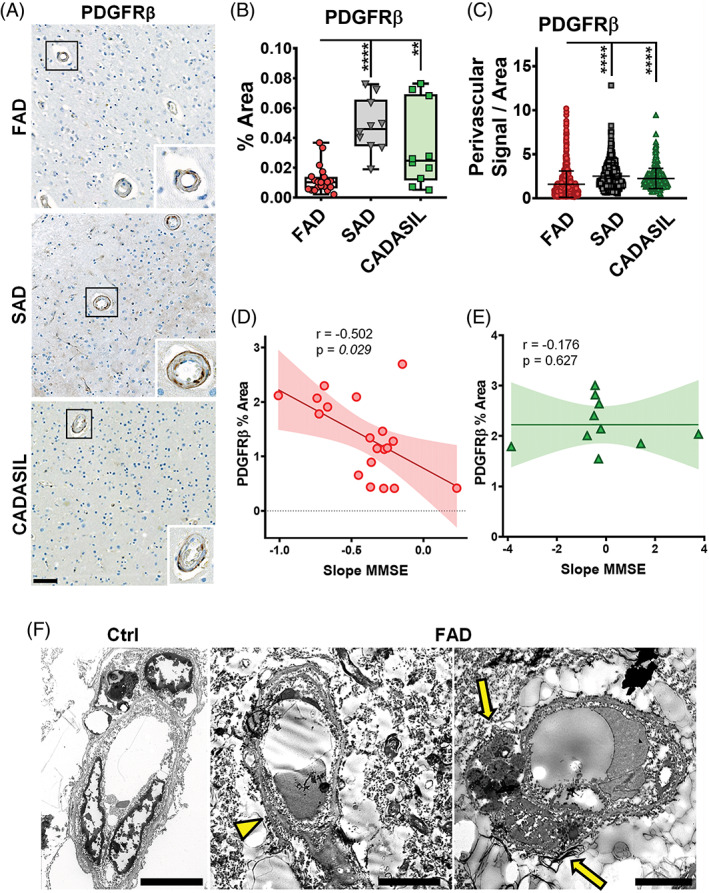
PDGFRβ and the BBB in PSEN1 p.Glu280Ala FAD, SAD and CADASIL. Representative images of PDGFRβ staining are shown for PSEN1 FAD, SAD and CADASIL (A), alongside enlargements of one vessel each, scale bar all panels = 50 μM. The PDGFRβ staining was quantified for PSEN1 FAD (n = 21), SAD (n = 10) and CADASIL (n = 10). The percentage of area covered by PDGFRβ‐positive signal is significantly lower in PSEN1 FAD versus SAD and CADASIL (B) (p values: **** ≤ 0.00001, ** ≤ 0.01). The perivascular PDGFRβ signal was measured for 30 vessels per each group. PSEN1 FAD cases presented with significantly less perivascular PDGFRβ than SAD and CADASIL (C) (p values: **** ≤ 0.0001). The %Area of PDGFRβ is significantly negative correlated with slope of MMSE (r = −0.502, p value: 0.029) while there is no significant correlation observed in CADASIL (r = −0.176, p value: 0.627) (D). Representative EM images are shown for a control (Ctrl) case and a PSEN1 FAD case (F). Thickening of the basement membrane (yellow arrowhead) and a pericyte undergoing apoptosis (yellow arrows) can be observed in FAD (scale bar = 5 μm).
