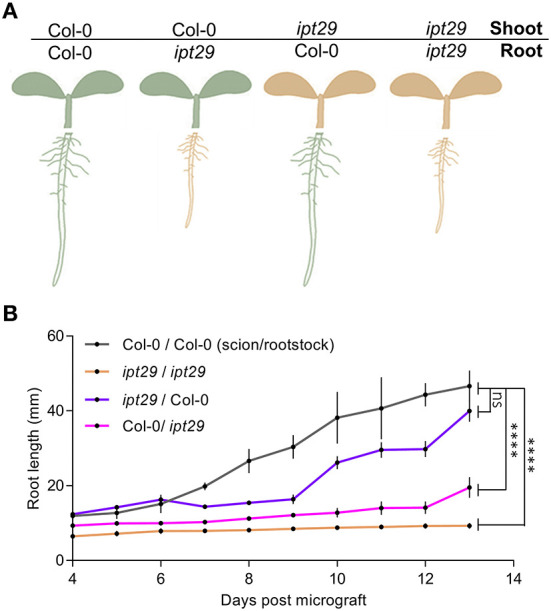
Figure 3.

ipt29 phenotype is mainly controlled by local signals. (A) Scheme representing grafting experiments performed between Col-0 and ipt29 shoot and root. Col-0 and ipt29 were self-grafted as controls. (B) Primary root growth of grafted seedlings. Dots indicate the average ± s.e.m. of the primary root length (n = 24) of grafted and self-grafted seedlings of the assorted genotypes. Asterisks indicate values significantly different from Col-0/Col-0 in a Student's t test (p < 0.0001). Additional statistical comparisons are available in Supplementary Table 2.
