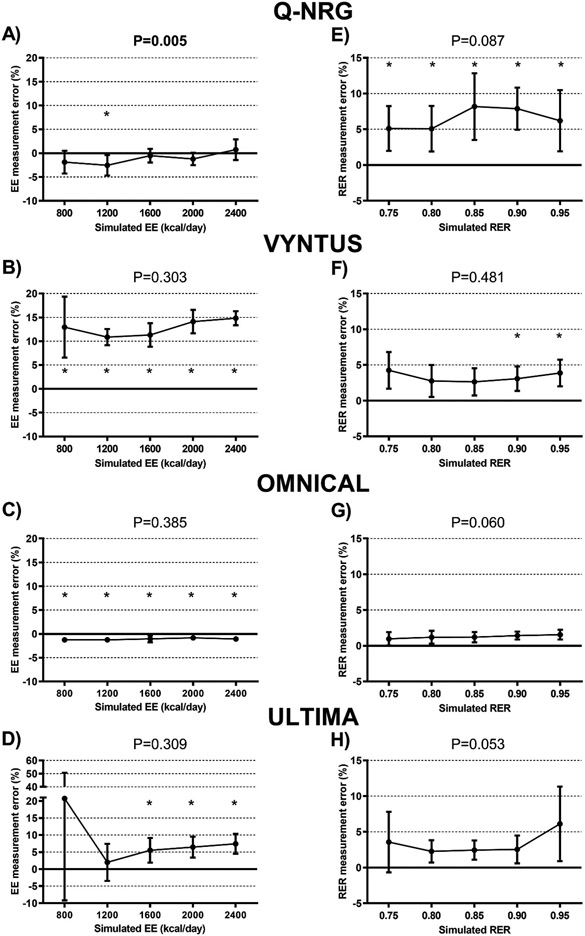
Fig. 2.
Measurement error of the four metabolic carts for the determination of energy expenditure (EE) and respiratory exchange ratios (RER), determined by controlled pure gas infusions. Panels A–D show the measurement error detected when simulating different energy expenditure levels. Panels E–H represent the measurement error detected when simulating different RER levels. P values from repeated measures analysis of variance (ANOVA, n = 5). * represents significant differences vs. zero value (one-sample t-test). Results are presented as mean and standard deviation.

