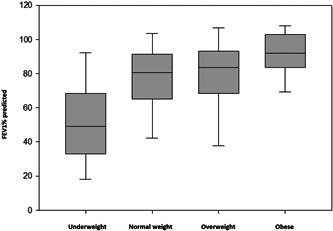
Figure 1.

FEV1% predicted among CDC weight categories, all patients. Underweight = BMI < 18.5/less than 5th percentile, normal/health weight = BMI 18.5–24.9/5th to less than 85th percentile, overweight = BMI 18.5–24.9/5th to less than 85th percentile, obese = BMI 18.5–24.9/5th to less than 85th percentile. One‐way ANOVA on ranks, p = 0.002. The ends of the boxes define the 25th and 75th percentiles, with a line at the median and error bars defining the 10th and 90th percentiles. ANOVA, analysis of variance; BMI, body mass index; CDC, Centers for Disease Control and Prevention; FEV1, forced expiratory volume in 1 s.
