Figure 3.

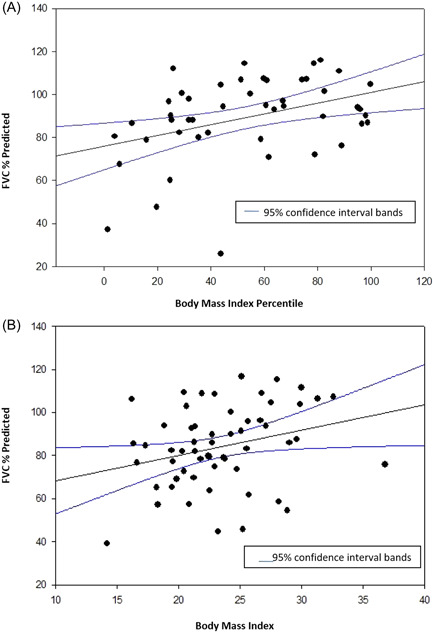
Body mass index versus FVC predicted in people with cystic fibrosis. (A) <20 years of age. R 2 = 0.153, p = 0.006. (B) >20 years of age. R 2 = 0.0781, p = 0.04. FVC, forced vital capacity.

Body mass index versus FVC predicted in people with cystic fibrosis. (A) <20 years of age. R 2 = 0.153, p = 0.006. (B) >20 years of age. R 2 = 0.0781, p = 0.04. FVC, forced vital capacity.