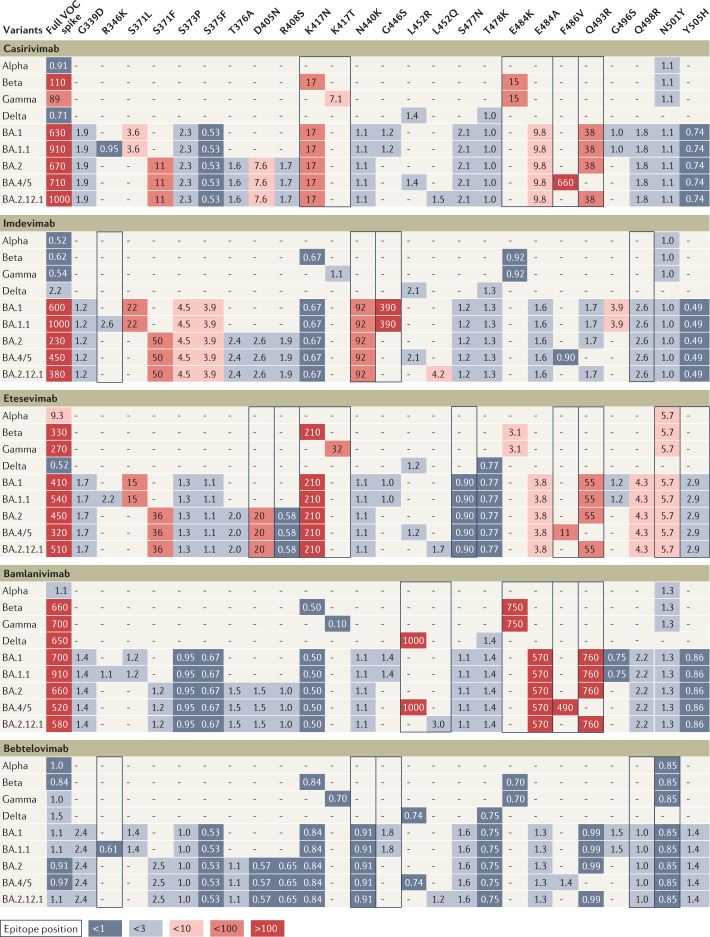
Fig. 2. Influence of individual spike mutations of interest on monoclonal antibody neutralization activity compared with antibody resistance of variants.
Heat map depicting fold change in monoclonal antibody (mAb) neutralization for variants of concern (VOCs) (left-most column) and individual mutations (other columns). Each row contains data for the full spike profile of a given VOC, as well as each definitive VOC mutation individually on a wild type background. Comparison of fold change values across a row indicates which mutations are responsible for any resistance shown by the full VOC. Values show geometric mean fold reduction in neutralization (mFRN). Boxes indicate epitope positions (see Supplementary Data File 3). Colours depict the strength of resistance: dark red, strong (mFRN > 100); red, moderate (mFRN = 10–100); light red, mild (mFRN = 3–10); light grey, no resistance (mFRN = 1–3); dark grey, increased sensitivity (mFRN < 1). ‘–’ indicates that the mutation is not present in the variant. All defining mutations at receptor binding domain (RBD) positions in VOCs are included. Supplementary Fig. 3 presents data for other mAbs for which less comprehensive data have been collected. The RBD is defined here as spike amino acid positions 319–541 (ref.65).

