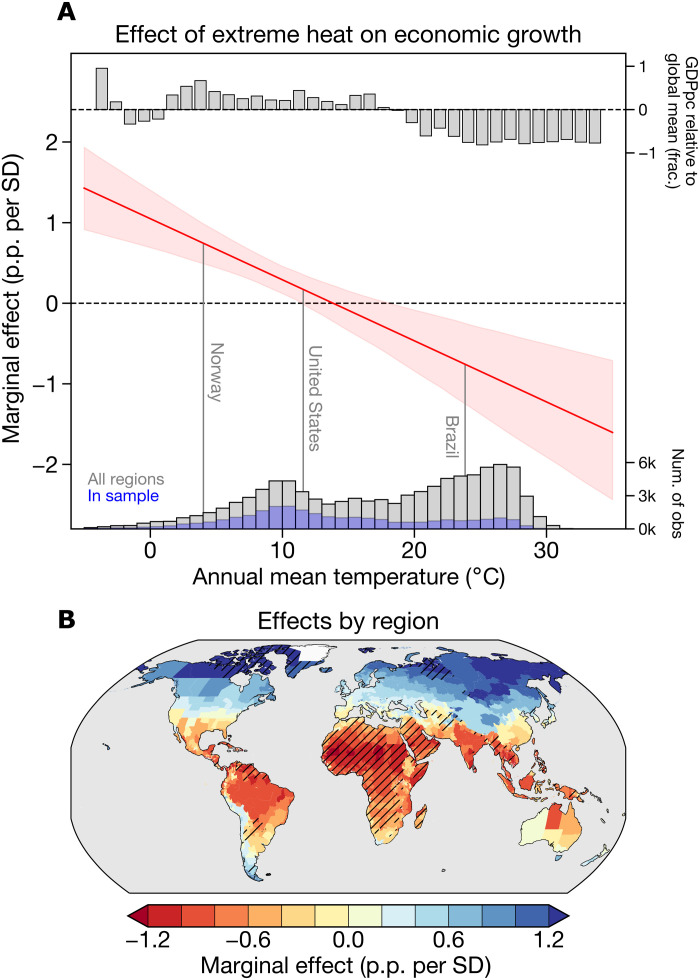
Fig. 1. Contemporaneous effect of extreme heat intensity on economic growth.
(A) Marginal effects of extreme heat on economic growth in percentage points per SD of Tx5d (p.p. per SD) across a range of temperatures. Solid red line shows average estimates across 1000 bootstrap iterations, and shading shows 95% confidence intervals (see Materials and Methods). Vertical lines show the average temperatures for regions within selected countries. Top bar plot shows the average regional Gross Domestic Product per capita (GDPpc) in each 1°C temperature bin relative to the global mean regional GDPpc. Bottom histogram shows the distribution of temperatures in the estimation sample (blue) and all observations (obs) (gray). (B) Marginal effects for each region based on their average temperatures; hatching denotes regions where economic data are unavailable. Marginal effects are scaled by the average within-region SD of Tx5d (see Materials and Methods).

