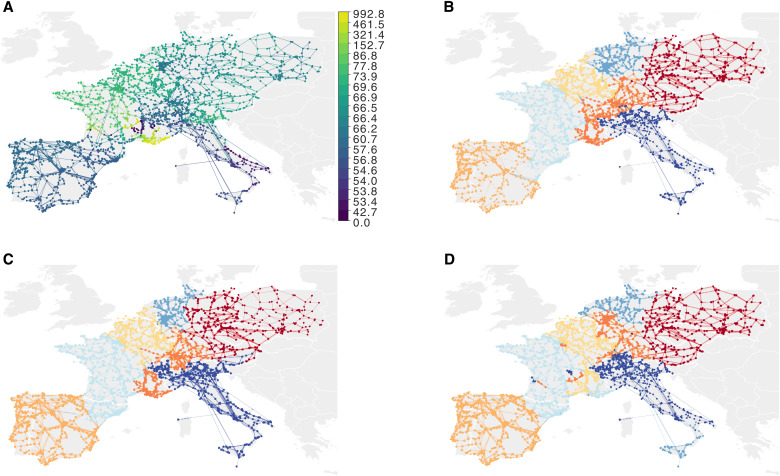
Fig. 10. European power grid network with node prices and optimal partitions.
(A) Node prices (€) distribute with lower prices in southern and central Europe and higher in western Europe. (B) With metadata strength s = 0, modules mix high- and low-price regions. In (C) and (D), node prices influence the partitions. (C) With s = 0.3, the module dominated by Italy grows to include the low-price region in eastern France and the module dominating eastern Europe grows to the west. (D) With s = 1, the red module containing northeastern France and Belgium grows to include the low-price region in southern France, dividing the higher-priced surrounding regions. Sicily splits from the lowest-priced regions of Italy.

