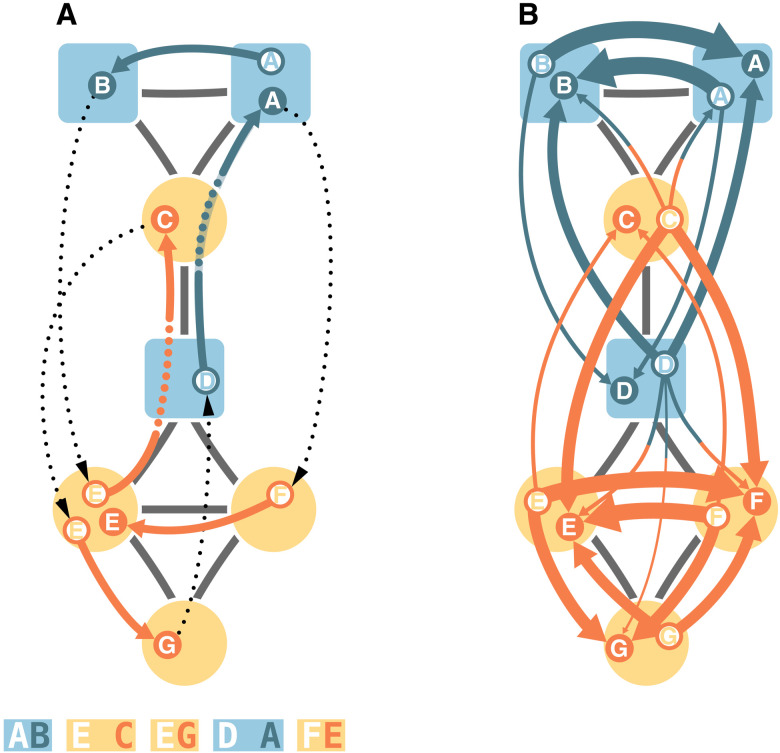
Fig. 2. Generating the metadata-dependent encoding graph.
(A) For ergodic results, we consider random walks that restart after each encoding at a random node proportional to its stationary visit rate. The random walk is colored by the currently encoded module and labeled with circles when it encodes a transition, with dotted colored lines when it skips nodes and with thin dotted lines when it restarts. If the target node’s metadata are the same as for the restart node, then we always encode. When the metadata differ, we encode with a probability of 5% like in Fig. 1C. The alphabetic codes represent the walk with this metadata-dependent encoding scheme. (B) Aggregating all encoded transitions and dividing by the total number of transitions give the metadata-dependent encoding graph. The line widths represent the probability flows of next encodings. For visual simplicity, we show only probability flows above 1%. Node shapes represent metadata, and node colors represent optimal partitions.

