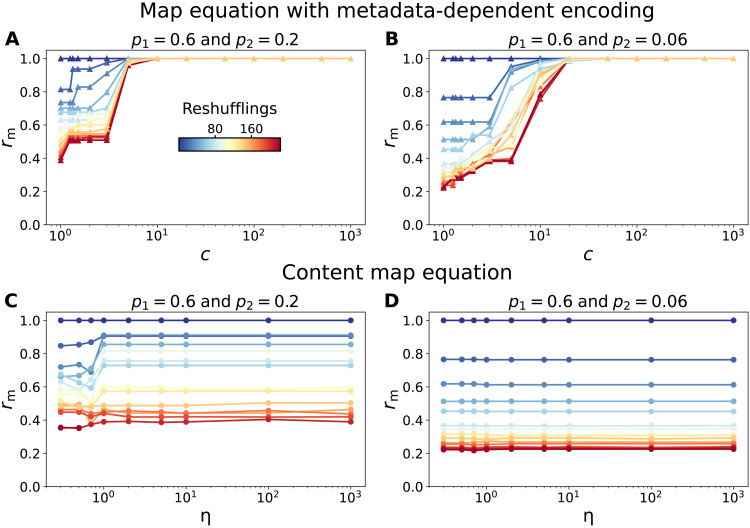
Fig. 5. Evolution of the mixing ratio rm for the map equation with metadata-dependent encoding and the content map equation as a function of the network structure and the correlation with metadata.
(A and B) Mixing ratio rm in the map equation with metadata-dependent encoding for p = 0.5 and increasing values of the metadata importance c in a network generated with (A) p1 = 0.6 and p2 = 0.2 and (B) p1 = 0.6 and p2 = 0.06. The colors indicate the number of metadata reshufflings going from low (blue) to high (red). (C and D) Mixing ratio rm in the content map equation for increasing values of the metadata importance η in a network generated with (C) p1 = 0.6 and p2 = 0.2 and (D) p1 = 0.6 and p2 = 0.06.

