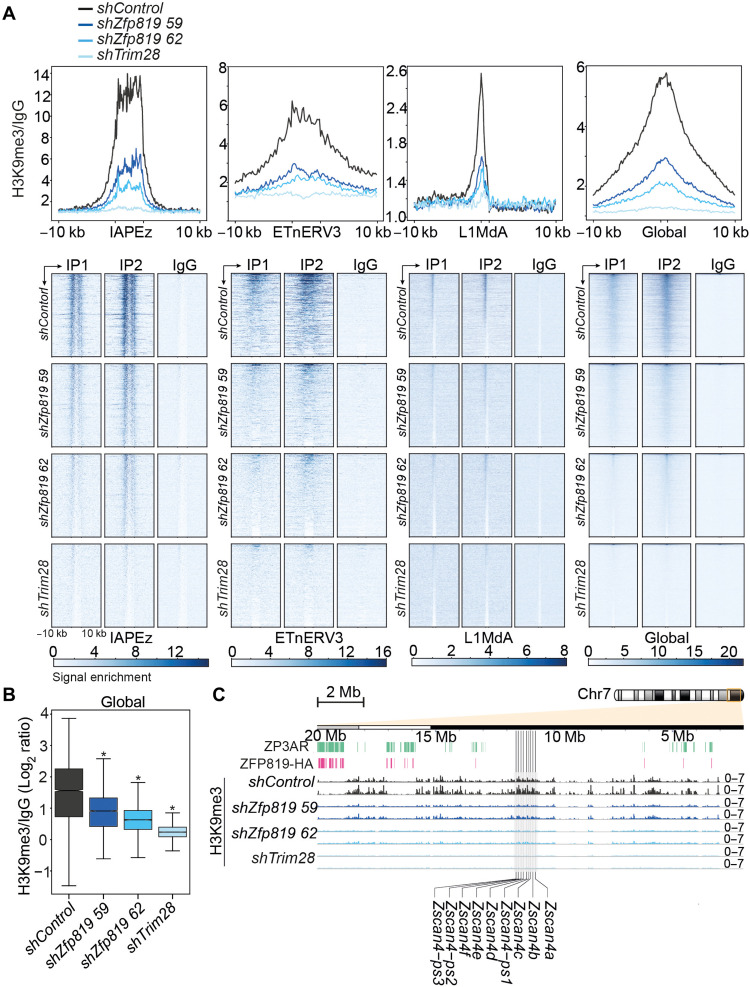
Fig. 3. ZFP819 depletion induces a global erosion of H3K9me3.
(A) Profile plots, with a 10-kb flank, represent the trimmed mean of H3K9me3 CUT&RUN coverage normalized to IgG at repeats and global H3K9me3 enrichment sites (top). Heatmaps of H3K9me3 CUT&RUN normalized read coverage, with a 10-kb flank, at repeats and global H3K9me3 sites (bottom). H3K9me3 CUT&RUN profiling was performed in GFPbright sorted shControl, shZfp819, and shTrim28 mESCs. The top 5000 H3K9me3 peaks obtained from the mouse ENCODE project define global H3K9me3 enrichment sites. (B) Distribution of the mean H3K9me3 signal at global H3K9me3 enrichment sites (top 5000 ENCODE peaks) for shControl, shZfp819, and shTrim28 mESCs. P = 0.0 (shZfp819 59, shZfp819 62, and shTrim28) (two-tailed paired Student’s t test compared to shControl). (C) Genome track view of an 18-Mb region along chromosome 7. H3K9me3 is represented as fold enrichment (H3K9me3 CUT&RUN normalized to IgG) in shControl, shZfp819, and shTrim28 mESCs. Coordinates of ZFP819-HA ChIP peaks, ZP3AR, and the Zscan4 gene cluster are annotated.

