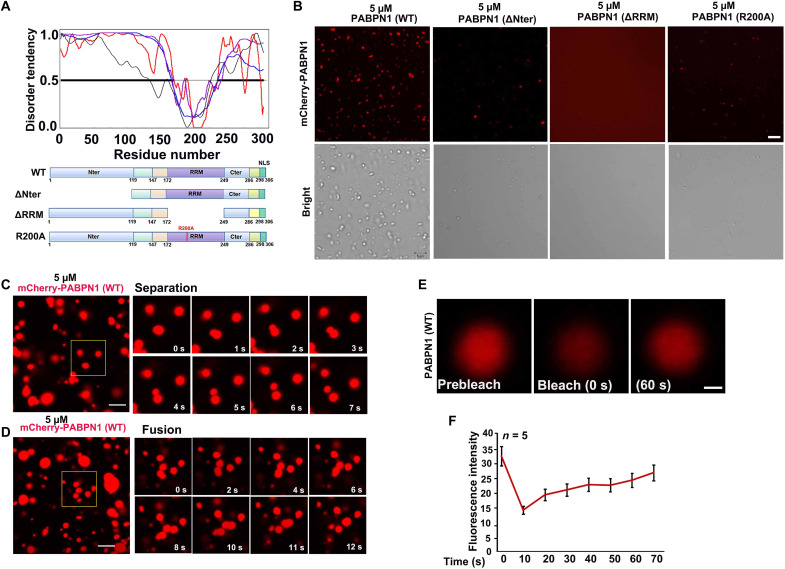
Fig. 4. The purified PABPN1 undergoes condensation properties in vitro.
(A) Disorder analysis of PABPN1 (306 amino acids). The plot shows the predicted disorder across full-length PABPN1 using various algorithms. The algorithms used were P-FIT (black line), VL3 (blue line), VL-XT (red line), and VSL2 (purple line). The diagram below shows the domains and boundaries of PABPN1 protein. Schematic diagram showing the four constructs of PABPN1: PABPN1 full length (WT), N-terminal deletion (ΔNter), RRM deletion (ΔRRM), and RRM mutation (R200A). (B) In vitro phase separation assay of mCherry-PABPN1 full length (WT), N-terminal deletion (ΔNter), RRM deletion (ΔRRM), and RRM mutation (R200A). Liquid condensates were formed after mixing 5 μM PABPN1 in the liquid system [20 mM tris-HCl (pH 7.5), 15 mM NaCl, 130 mM KCl, 5 mM KH2PO4, 1.5 mM MgCl2, bovine serum albumin (BSA) (1 mg/ml), and 10% polyethylene glycol, molecular weight 8000 (PEG-8000)]. Scale bar, 5 μm. (C and D) Time-lapse images of condensate separation and fusion events occurring in purified full-length PABPN1 in vitro. Scale bars, 10 μm. (E) Image of purified full-length PABPN1 before (left), during (middle), and after (right) photobleaching. The time relative to photobleaching (0 s) has been indicated. (F) Signal intensity (y axis) versus time relative to photobleaching (x axis). Data have been presented as the average relative intensity ± SD (n = 5).

