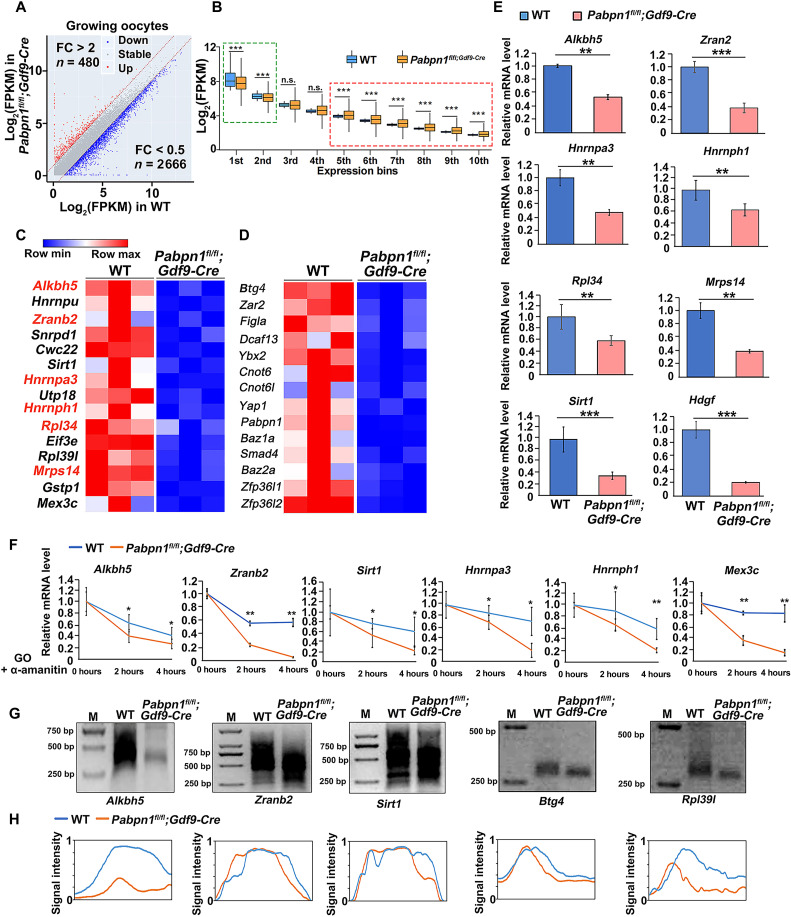
Fig. 8. Transcriptomic analyses of Pabpn1-null oocytes.
(A) Scatter plot of the relative transcript levels in WT and Pabpn1-deletion growing oocytes. Transcripts (n) whose levels decreased or increased by more than twofold have been highlighted in blue and red, respectively. FC, fold change. (B) Box plot showing gene expression levels of WT and Pabpn1fl/fl;Gdf9-Cre mouse oocytes at the growing stage. Genes were divided into 10 bins according to their expression levels in WT oocytes. The box indicates the upper and lower quantiles, the thick line in the box indicates the median, and the whiskers represent the 2.5th and 97.5th percentiles. ***P < 0.001, as assessed using two-tailed Student’s t test. Green box, transcripts with high levels in growing oocytes; red box, transcripts with low levels in growing oocytes. (C and D) Heatmap of the transcripts related to mRNA metabolism (C) and oocyte development (D) that showed decreased levels in Pabpn1fl/fl;Gdf9-Cre mice, as compared to those in WT mice. (E) Quantitative RT-PCR results showing the relative levels of the indicated transcripts in WT and Pabpn1-deletion oocytes after transcription inhibition by α-amanitin. Error bars represent the SEM. Statistical analysis was performed using Student’s t test. **P < 0.01 and ***P < 0.001. (F) RT-qPCR results showing the changes in transcript levels in WT and Pabpn1-null oocytes. Data have been represented as means ± SEM from at least three independent experiments and have been compared using one-way analysis of variance (ANOVA). *P < 0.05 and **P < 0.01. (G) Changes in poly(A) tail length of transcripts from WT and Pabpn1fl/fl;Gdf9-Cre mouse oocytes, as assessed using poly(A)-tail assay. (H) Relative signal intensity (y axis) and length of PCR products based on mobility (x axis) in (G). cKO, conditional knockout.

