Figure 3.

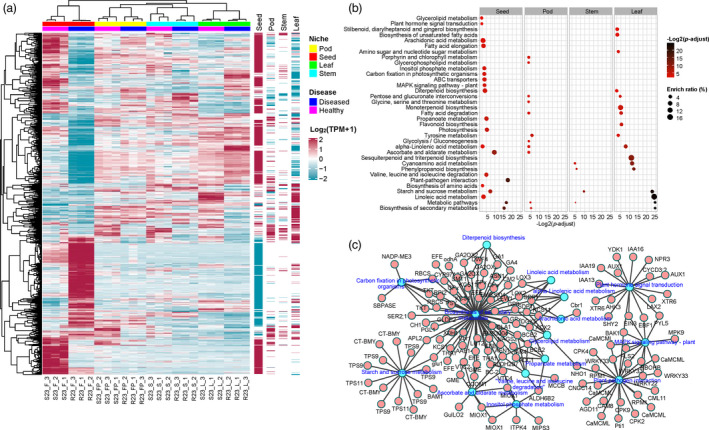
Transcriptome profiles of SGS affected genes and pathways across diverse soybean compartments. (a) Hierarchical clustered heatmap of differentially expressed genes (DEGs) between healthy and SGS diseased samples across diverse soybean compartments. DEGs with ¦log2 FC¦ > 2 (FC, fold change) and adjusted P‐value < 0.01 were displayed in the heatmap. Columns on the right indicate DEGs that are categorized as SGS disease induced (red line) and deduced (blue line) gene sets. (b) KEGG pathway enrichment analysis of SGS induced DEGs across diverse soybean compartments. The enriched ratio and FDR‐adjusted enrichment P‐value of the pathway were indicated using the size and colour of the bubble points, respectively. (c) The pathway‐gene network of the particular genes induced in SGS diseased seeds in each terms of the enriched KEGG pathways.
