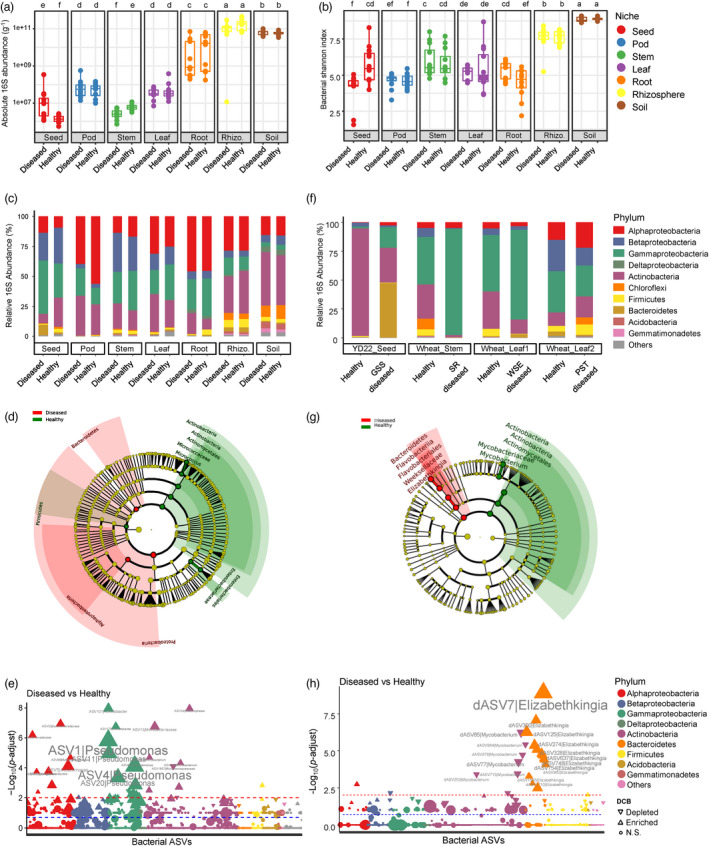
Figure 4.

SGS results in seed microbiomes dysbiosis. (a and b) Comparison of the bacterial loads (a) and Shannon's diversity index (b) between healthy and SGS diseased samples in diverse soybean compartments, respectively. Post hoc test is indicated by letters at the top, sample groups with the same letter are indistinguishable at 95% confidence. n = 12 biological replicates. (c) Comparison of the phylum‐level distribution of the bacterial microbiota between healthy and SGS diseased samples in diverse soybean compartments. Average relative abundance of 12 biological replicates are displayed in separate stacked bars. (d) LDA effect size taxonomic cladogram comparing bacterial microbiota between healthy and SGS diseased seeds of Zhoudou cultivars. (e) Manhattan plots showing SGS enriched and depleted ASVs in seeds of Zhoudou cultivars. (f) Comparison of the phylum‐level distribution of the bacterial microbiota between healthy and diseased samples associated with diverse plant diseases. YD22_Seed: seeds of soybean cultivar YD22 associated with SGS (n = 5 biological replicates); Wheat_Stem: stems of wheat associated with wheat stem rot (SR) complex (n = 6); Wheat_Leaf1: leaves of wheat associated with wheat sharp eyespot (WSE) (n = 7); Wheat_Leaf2: leaves of wheat associated with wheat stripe rust (WSR) (n = 10). (g) LDA effect size taxonomic cladogram comparing bacterial microbiota between healthy and SGS diseased seeds of YD22. (h) Manhattan plots showing SGS enriched and depleted ASVs in seeds of soybean YD22. For (e and h), ASVs that are significantly enriched in SGS diseased seeds are depicted as vertical triangles, that are significantly depleted in SGS diseased seeds are depicted as inverted triangles, otherwise depicted as circles. The red and blue dashed line corresponds to the FDR‐corrected P‐value of 0.01 and 0.05, respectively. The colour of each point represents the phylum‐level taxonomic affiliation of the ASVs, and the size corresponds to the baseMean of the ASVs.
