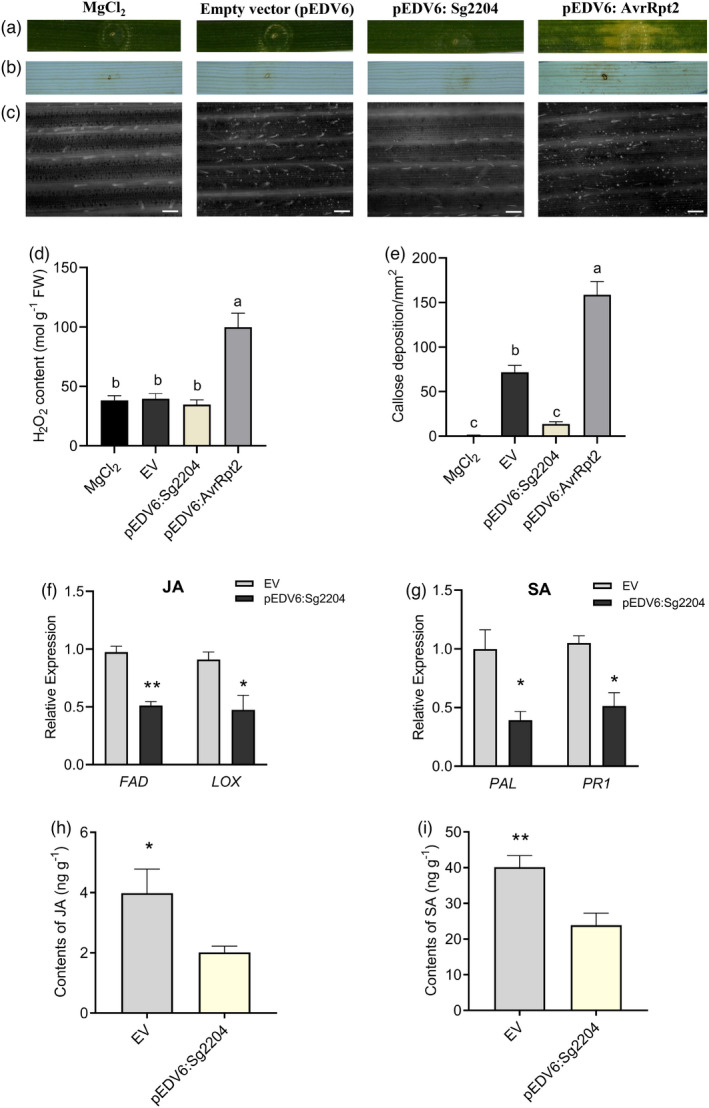
Figure 4.

Delivery of Sg2204 into wheat suppressed plant defence. (a) Phenotypes of wheat leaves inoculated with MgCl2 buffer (mock), Pseudomonas fluorescens EtHAn carrying pEDV6 (empty vector, EV), pEDV6:Sg2204 and pEDV6:AvrRpt2 (positive control) at 72 h after infiltration. (b) DAB staining for H2O2 accumulation in wheat leaves infiltrated with MgCl2 buffer, P. fluorescens EtHAn carrying EV, pEDV6:Sg2204 and pEDV6:AvrRpt2 at 72 h after infiltration. (c) Callose deposition observed by fluorescence microscopy in wheat leaves infiltrated with MgCl2 buffer, P. fluorescens EtHAn carrying EV, pEDV6:Sg2204 and pEDV6:AvrRpt2 at 72 h after infiltration after aniline blue staining. Bars = 200 μm. (d) H2O2 content of wheat leaves inoculated with MgCl2 buffer, EV, pEDV6:Sg2204 or pEDV6:AvrRpt2. (e) Average number of callose deposits/mm2 in wheat leaves treated with MgCl2 buffer, EV, pEDV6:Sg2204 or pEDV6:AvrRpt2. Three biological replicates were performed for each treatment. Data are presented as the mean ± SE. Different lowercase letters above the bars indicate significant differences among groups (one‐way ANOVA followed by Duncan's multiple range tests, P < 0.05). (f) The expression levels of JA synthesis‐related genes FAD and LOX in wheat leaves after infiltration with P. fluorescens EtAnH carrying an empty vector (EV) or pEDV6:Sg2204 at 72 h. (g) The expression levels of the SA synthesis‐related gene PAL and the SA signalling pathway marker gene PR1 in wheat leaves after infiltration with an empty vector (EV) or pEDV6:Sg2204 at 72 h. (h) Change in endogenous JA contents in wheat leaves treated with P. fluorescens EtAnH carrying an empty vector (EV) or pEDV6:Sg2204. (i) Change in endogenous SA contents in wheat leaves inoculated with P. fluorescens EtAnH carrying an empty vector (EV) or pEDV6:Sg2204. Three biological replicates were performed for each treatment. Data are presented as the mean ± SE. Asterisks above the bars indicate significant differences between controls and treatments (*P < 0.05; **P < 0.01; Student's t test).
