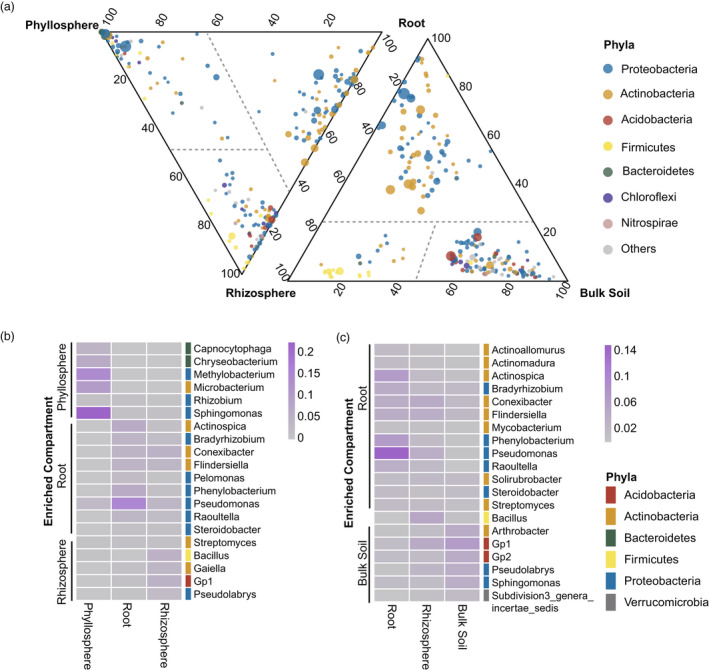
Figure 2.

Enrichment of microbial genera in plant‐associated environments. (a) Ternary plots comparing relative abundance of all genera (>0.01%) among phyllosphere, root and rhizosphere microbiomes (left), and among root, rhizosphere and bulk soil microbiomes (right). A negative binomial generalized linear model was performed followed by a likelihood ratio test for comparing the microbial relative abundance between compartments at the genus level. Points represented microbial genera and size represented the average relative abundance across all the three compared compartments. Microbial genera were coloured by their belonged phyla. The seven most abundant microbial phyla for each compartment were shown and other phyla were aggregated into ‘others’. Position of points represented its relative abundance with respect to each compartment. Points were separated by dashed lines, representing their enriched compartment. (b) Heatmap of the 20 most abundant enriched genera compared among phyllosphere, root and rhizosphere microbiomes. (c) Heatmap of the 20 most abundant enriched genera compared between root and rhizosphere and bulk soil microbiomes. Blocks in heatmap were filled with different colour representing the relative abundance of microbial genera. Colour bars on the right of heatmap were labelled by the belonged microbial phyla.
