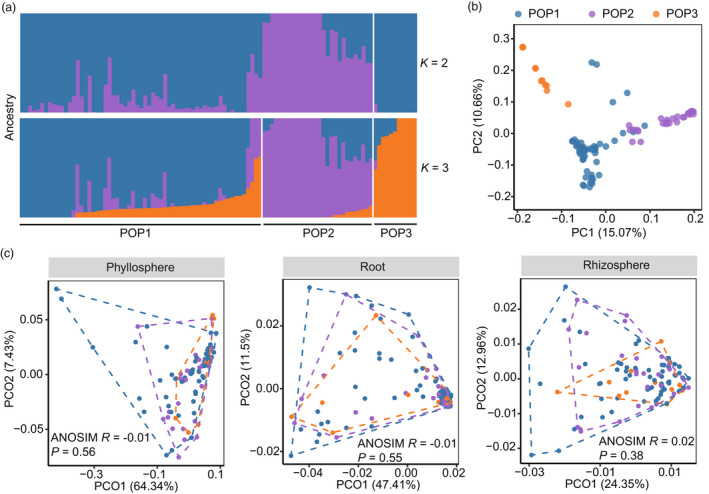
Figure 3.

Effects of tea (Camellia sinensis) genetic diversity on plant‐associated microbiomes. (a) Ancestry analysis of 100 tea cultivars. The maximum likelihood estimation of ancestries (K) for tea cultivars (n = 100) was estimated. Five‐fold cross‐validations were performed with K values ranging from 2 to 10. And the most probable number of subpopulations (POP) was estimated by the lowest cross‐validation error, which was K = 3 here (Figure S2). Tea cultivars were clustered into three groups by hierarchical cluster analysis based on their genetic dissimilarity matrix. (b) Principal component analysis of the tea genetic dissimilarity. (c) Comparisons of microbial β‐diversity between tea subpopulations. Principal coordination analysis (PCoA) for microbiomes in phyllosphere, root and rhizosphere was performed. Points represented tea cultivars (n = 100) and were coloured by the predicted subpopulations. The microbial weighted UniFrac dissimilarity between subpopulations was compared by the analysis of similarity (ANOSIM).
