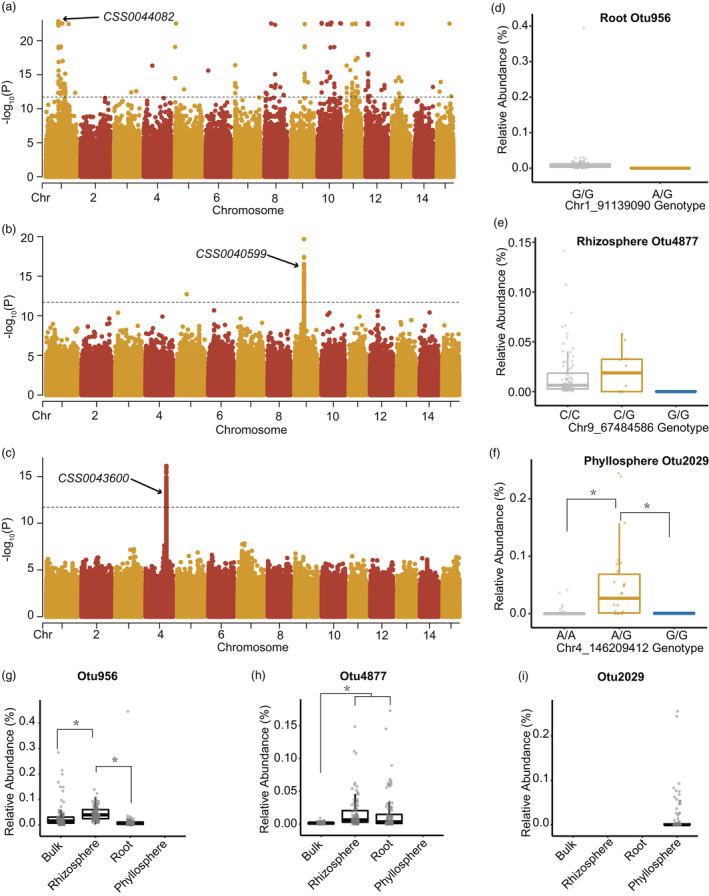
Figure 4.

Genome‐wide associations between tea (Camellia sinensis) genetic variants and the abundance of individual microbes. (a–c) Manhattan plots for the genome‐wide associations of root endosphere Otu956 (a), rhizosphere Otu4877 (b) and phyllosphere Otu2029 (c). The dashed line represented the significance level of 1.95 × 10⁻¹² (transformed with –log10; Bonferroni correction). The candidate genes of the nonsynonymous exonic variants were indicated by arrows. (d–f) Relative abundance of the microbial taxa compared between the genotypes of significant genetic variants. (g–i) Relative abundance of the microbial taxa compared between the four compartments.
