
Figure 6.
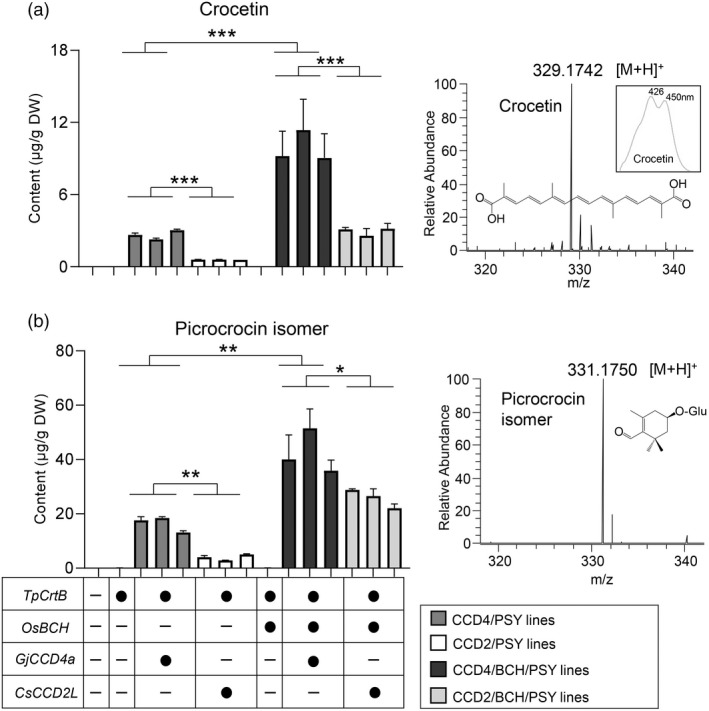
Identification and relative quantification of crocetin and picrocrocin in different engineered callus lines. Levels and high‐resolution MS spectra of crocetin (a) and picrocrocin isomer (b) in different engineered callus lines. The gene combinations are indicated below bars (black circle, was expressed; minus, was not included). Different coloured blocks represent different engineered callus lines as indicated in the key. Insets display structures and/or UV/vis spectrum of crocetin and picrocrocin.