Figure 3.
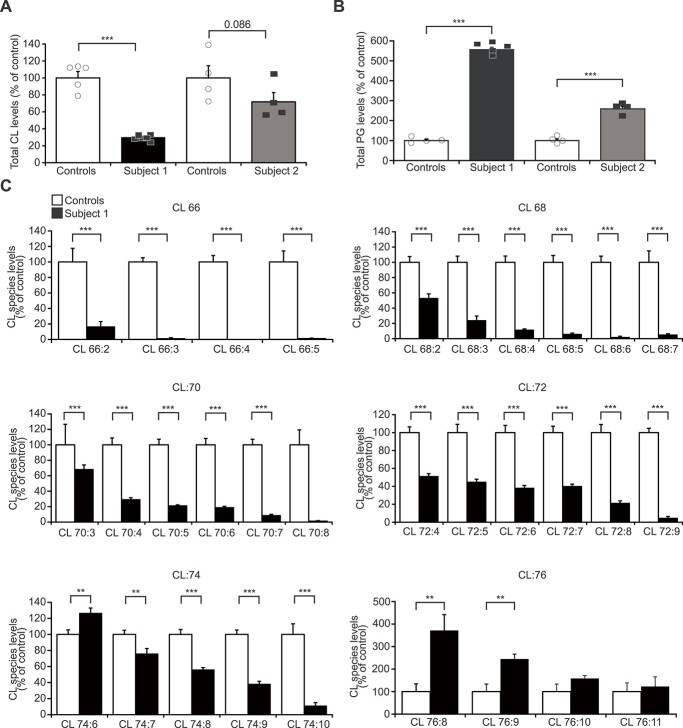
The CRLS1 variants alter CL abundance and acyl-chain profile. (A) Total cardiolipin (CL) levels in control and patient fibroblasts determined by mass spectrometry–based lipidome analysis from at least four independent biological samples. Data are displayed as percent of respective control levels. (B) Phosphatidylglycerol (PG) levels in controls and Subjects 1 and 2 fibroblasts. (C) Cardiolipin acyl-chain composition of Subject 1 cells. Data are percent change of each species compared to control levels and shown as mean ± SEM. FDR < 0.05, *; FDR < 0.01, **; FDR < 0.001, ***.

