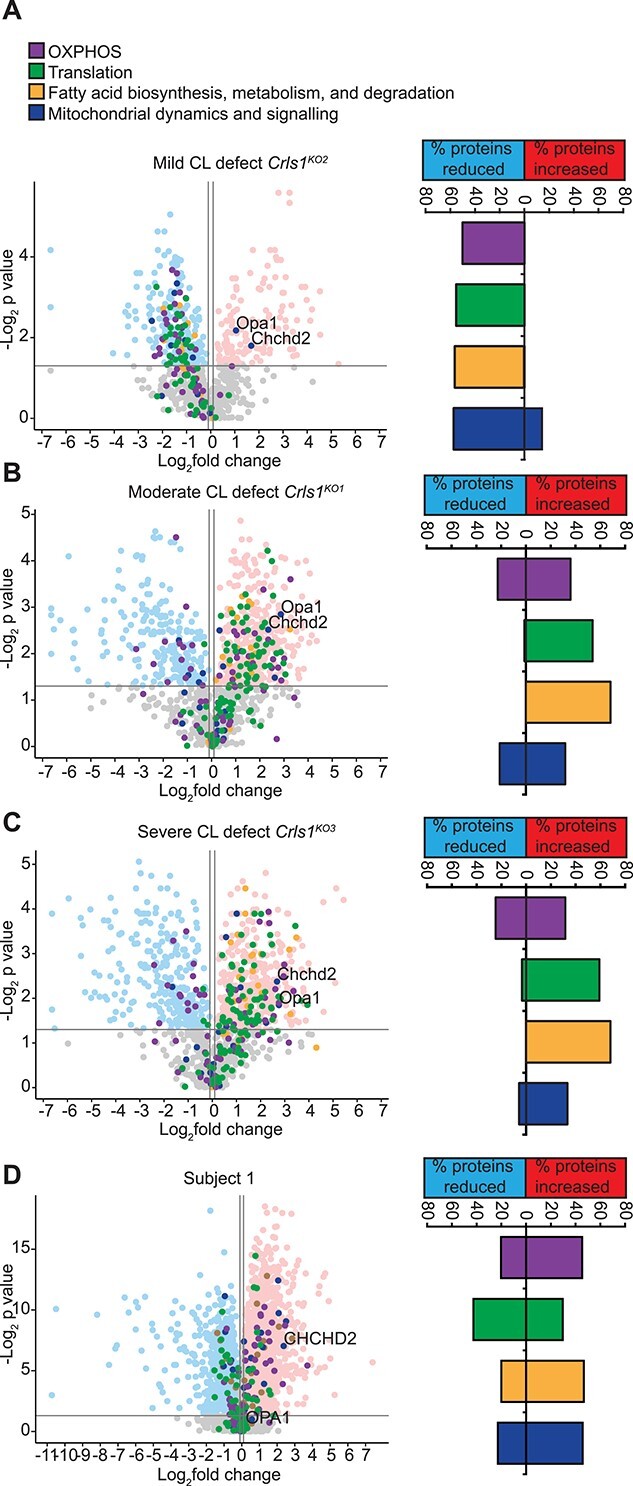
Figure 5.

Mitoproteome profiles are altered based on severity of the CL defect. Volcano plots of quantitative mitoproteome analyses showing the percent of detected proteins significantly changing for each highlighted pathway for (A) mild (Crls1KO2), (B) moderate (Crls1KO1), (C) severe (Crls1KO3) and (D) Subject 1 cells relative to their respective control cells. Data are from five independent biological samples.
