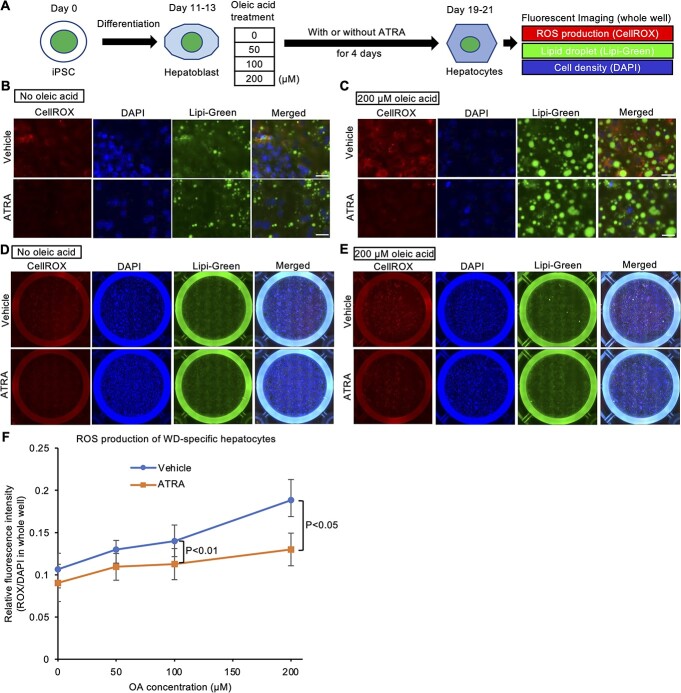
Figure 8.
ATRA decreases oleic acid-induced ROS production in WD-iPSC-derived hepatocytes. (A) Schematic illustration of a cellular assay of ROS production and lipid accumulation in WD-iPSC-derived hepatocytes treated with different concentrations of oleic acid with or without ATRA. (B and C) Representative magnified lipid fluorescent images of CellROX, DAPI and Lipi-Green in HPS0045-derived hepatocytes on differentiation day 19 after oleic acid treatment at 0 μM (B) or 200 μM (C) for 8 days with or without ATRA for 4 days. Scale bar = 25 μm. (D and E) Representative tiled whole well fluorescent images of CellROX Deep Red, DAPI and Lipi-Green in HPS0045-derived hepatocytes after oleic acid treatment at 0 μM (E) or 200 μM (F) for 8 days with or without ATRA for 4 days. (F) Quantified ROS production at different concentrations of oleic acid with or without ATRA across all four WD patient-derived hepatocyte types (HPS0045, HPS0049, HPS0053 and HPS2807). Fluorescence intensity of CellROX and DAPI was calculated from tiled whole well fluorescent images. Data are shown as the mean ± SEM (n = 4). P-values were determined by two-tailed Student’s t-tests for paired samples from each cell line.

