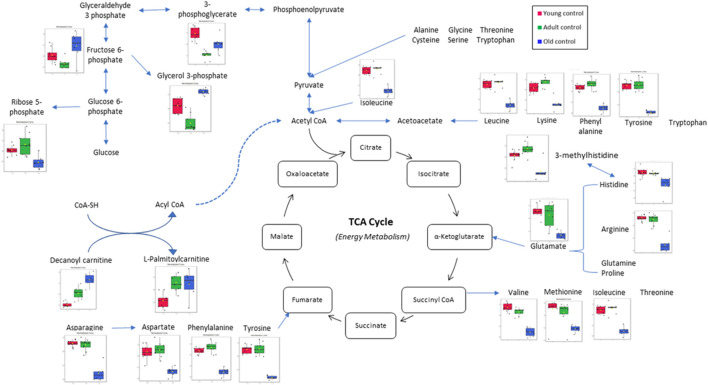
FIGURE 8.
Muscle metabolomes changes in ageing rats. Metabolite concentrations in muscle specimens are depicted graphically and subjected to quantitative analysis. Box and whiskers plots with 95% confidence intervals are presented for quantified amino acids. Analysis was performed using one-way Anova with Tukey’s post hoc analysis. *p < 0.05.

