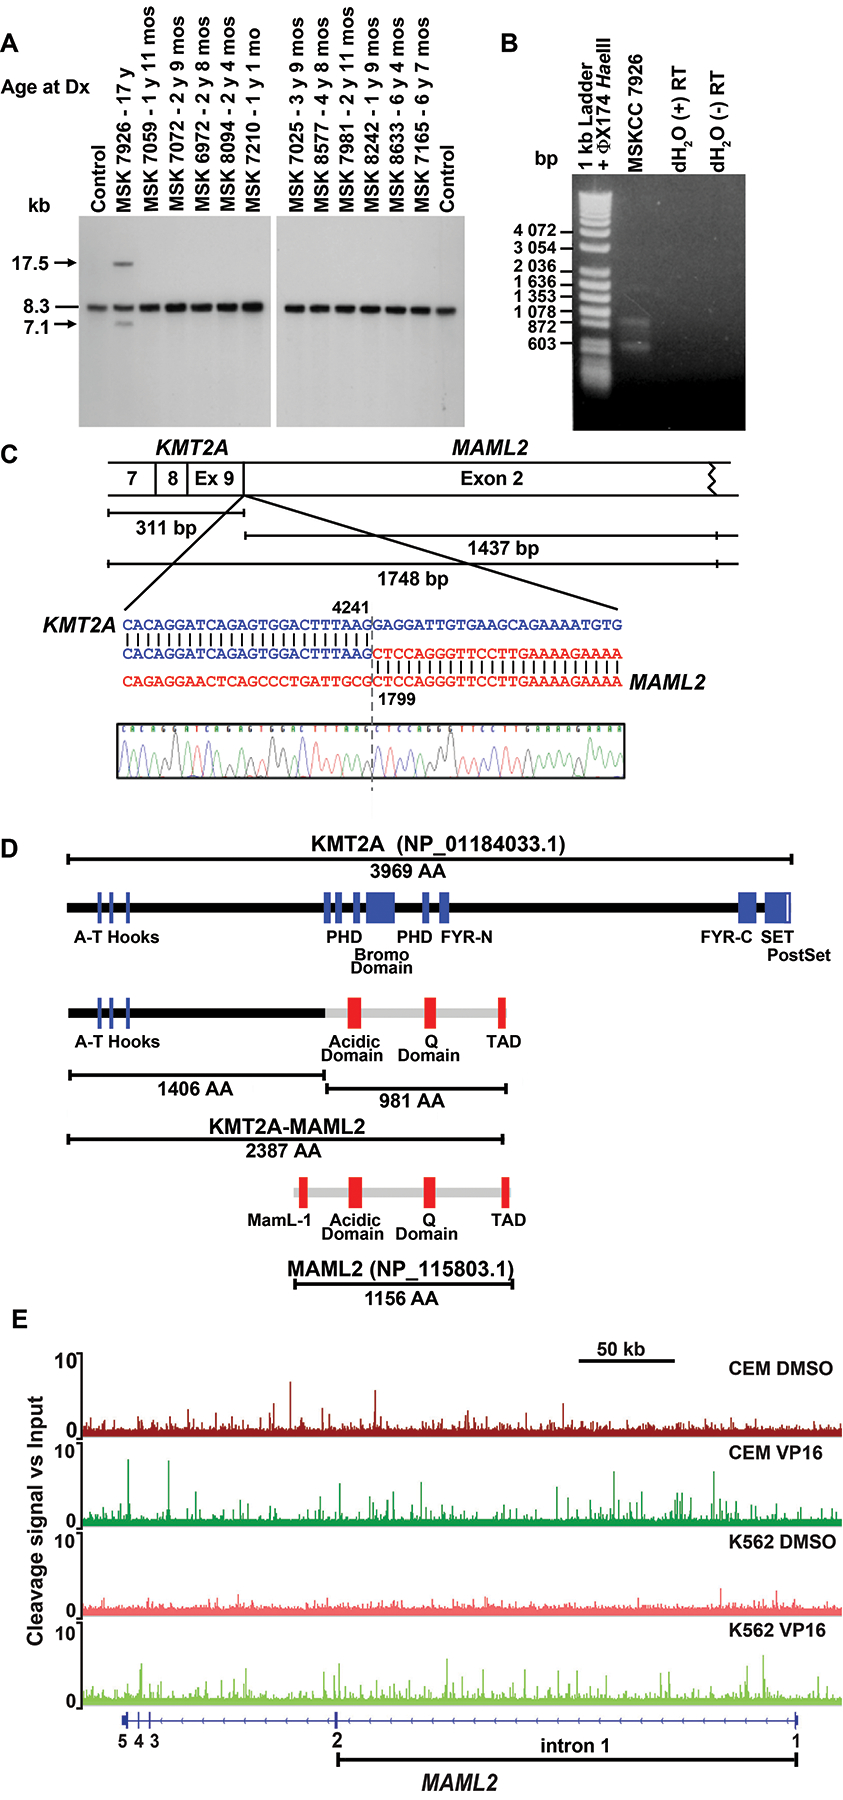
Fig. 2.

Molecular analysis of KMT2A rearrangement. (A) Southern blot analysis of bone marrow samples of 12 pediatric patients who did not develop leukemia by time of completion of all 7 cycles of MSK-N7 chemotherapy. Arrows show rearrangements; dash, germline bands. Genomic DNA and total RNA were prepared on GITC/CsCl gradients. Southern blot analysis used 5 μg BamHI-digested DNA. B859 fragment of KMT2A cDNA was radiolabeled with 32P by nick translation12,13. Normal adult peripheral WBCs isolated by ACK lysis of red blood cells in whole blood were control. (B) cDNA panhandle PCR12 identification of unknown 5’-KMT2A-partner-3’ transcript. First strand cDNA prepared from bone marrow RNA after chemotherapy cycle 7 using 5’-KMT2A-NNNNNN-3’ primers12, was amplified in two independent cDNA panhandle PCRs. Gel shows products of one reaction, which vary in size as expected12. Products of the two cDNA panhandle PCRs were subcloned by recombination PCR12, 31 and 63 subclones from which, respectively, were sequenced. (C) Fusion transcript sequence compared to native KMT2A (GenBank accession no. NM_001197104.1) and the full-length 5-exon 7115 bp MAML2 (GenBank accession no. NM_032427.3) mRNA reference sequences with coordinates at point of fusion indicated. One subclone contained transcript sequence joining KMT2A exon 9 in-frame to MAML2 exon 2. Exon numbering is according to NCBI. Ninety-two subclones contained KMT2A transcript sequence only, with normally spliced, alternatively spliced and scrambled exons. One subclone was vector only. (D) Schematic of predicted fusion protein (middle) compared to native KMT2A and MAML2 (top and bottom). Amino acids 1 to 1406 from KMT2A are joined to acidic domain, Q domain and carboxyl-terminal TAD of MAML2. The first of three poly-glutamine tracts comprising the Q domain, in which the number of glutamine (Q) repeats is known to vary, contains 30 Q residues in the fusion protein compared to 34 in the reference sequence (GenBank accession no. NM_032427.3). This is accounted for in number of amino acids in the fusion protein. (E) TOP2A cleave-ome data for K56228 and CEM (Yu and Davenport, unpublished) cell lines illustrating cleavage along Chromosome band 11q21 in MAML2 gene body. The Y axis shows fold-change in TOP2A cleavage signal relative to input. Note many peaks in intron 1 (bracketed) in presence of etoposide (VP16) not detected in vehicle treated samples, indicating enriched cleavage with etoposide, of interest because 5’-KMT2A exon 9-MAML2 exon 2–3’ transcript (C) signifies a MAML2 genomic breakpoint upstream to start of exon 2. Fold-change in cleavage signal was plotted and tracts along MAML2 captured using IGV.
