
Figure 2.
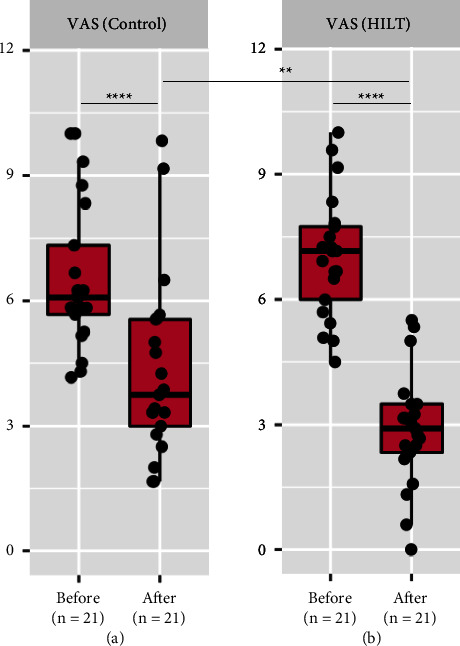
Box plot showing overall analysis of changes in the VAS scores within the same group and compared between the groups. (a). Change in the VAS score in the control group compared before and after treatment completion. (b). Change in the VAS score in the HILT group compared before and after treatment completion. Data are shown as ns (not significant) = p value >0.05, ∗ = p value <0.05, ∗∗ = p value <0.01, ∗∗∗ = p value <0.001, and ∗∗∗∗ = p value <0.0001. HILT, high-intensity laser therapy; VAS, visual analogue scale.