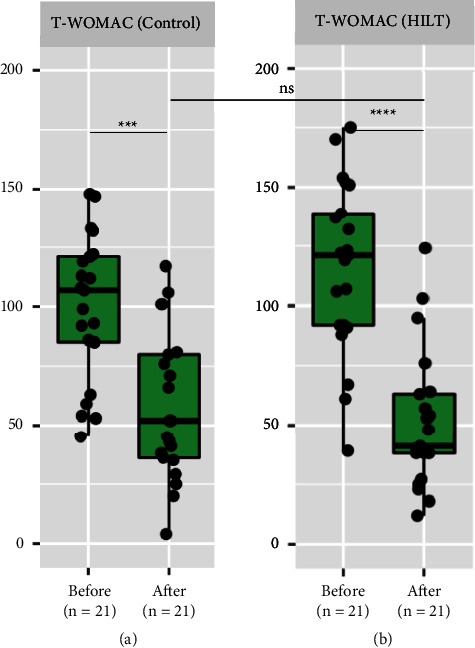
Figure 3.

Box plot showing overall analysis of changes in the T-WOMAC scores within the same group and compared between the groups. (a). Change in the T-WOMAC score in the control group compared before and after treatment completion. (b). Change in the T-WOMAC score in the HILT group compared before and after treatment completion. Data are shown as ns (not significant) = p value >0.05, ∗ = p value <0.05, ∗∗ = p value <0.01, ∗∗∗ = p value <0.001, and ∗∗∗∗ = p value <0.0001. HILT, high-intensity laser therapy; T-WOMAC, the modified Thai version of Western Ontario and McMaster Universities Osteoarthritis Index.
