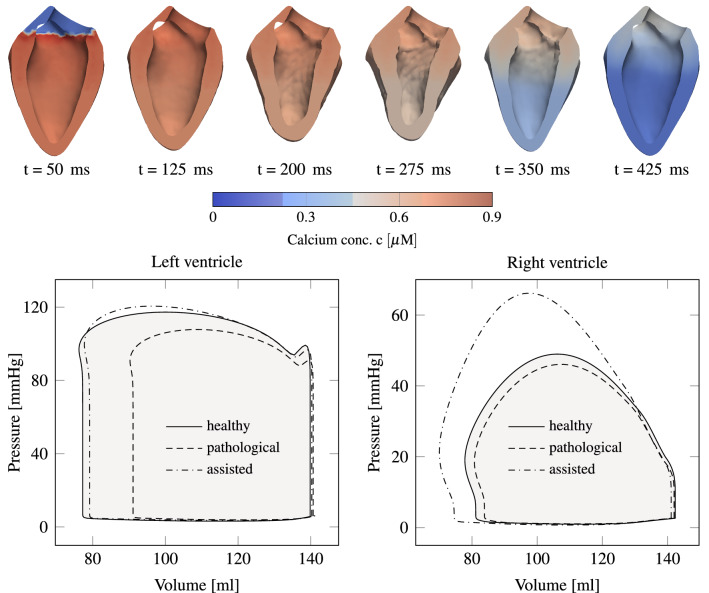
Figure 11.
Top: left ventricular deformation during one heartbeat of a diseased model, which is assisted by two opposite patches. The contraction pattern is different compared to healthy conditions (Fig. 6), particularly in the patch regions. The calcium spread is visualized by the color. Bottom: p-V loops for a healthy, a pathological and an assisted pathological heart are presented. The diseased heart has an infarction radius of 3 cm. In order to obtain the same power output as the healthy heart, the pathological heart has to be assisted with a peak displacement of 0.9 cm for both patches.

