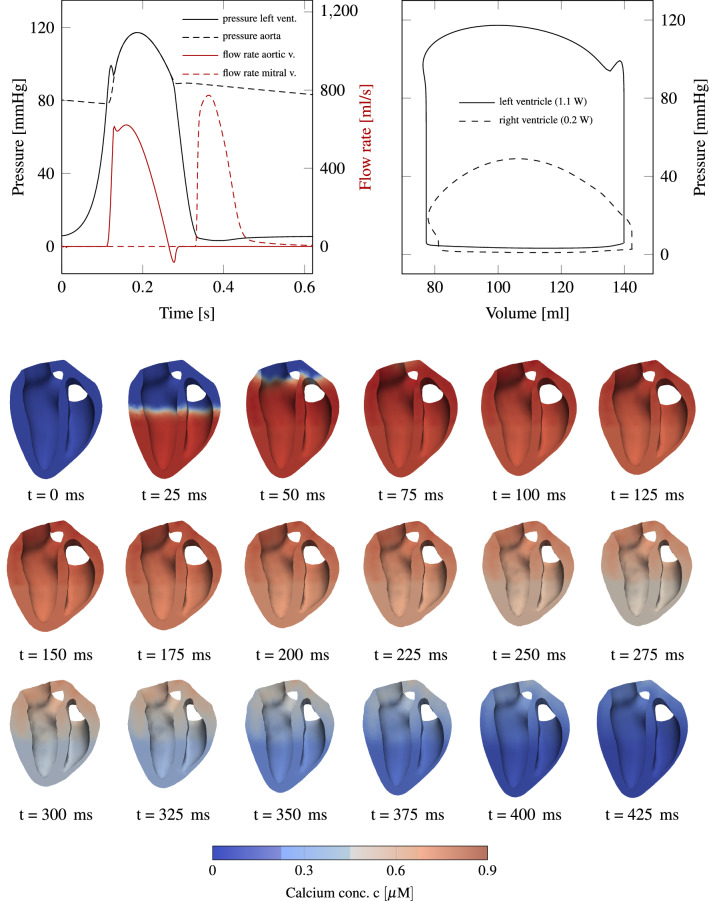
Figure 6.
Top left: pressure and flow rate evolution for left ventricular variables. Top right: p-V loop of both ventricles. The work done per heart-beat is equal to the area inside the p-V loops. A total power output of 1.3 W18 is in good agreement with measurements. Below a sequence of slices through the left and right ventricles for the first 420 ms of a heartbeat is shown. Color indicates how the calcium concentration spreads through the domain.

