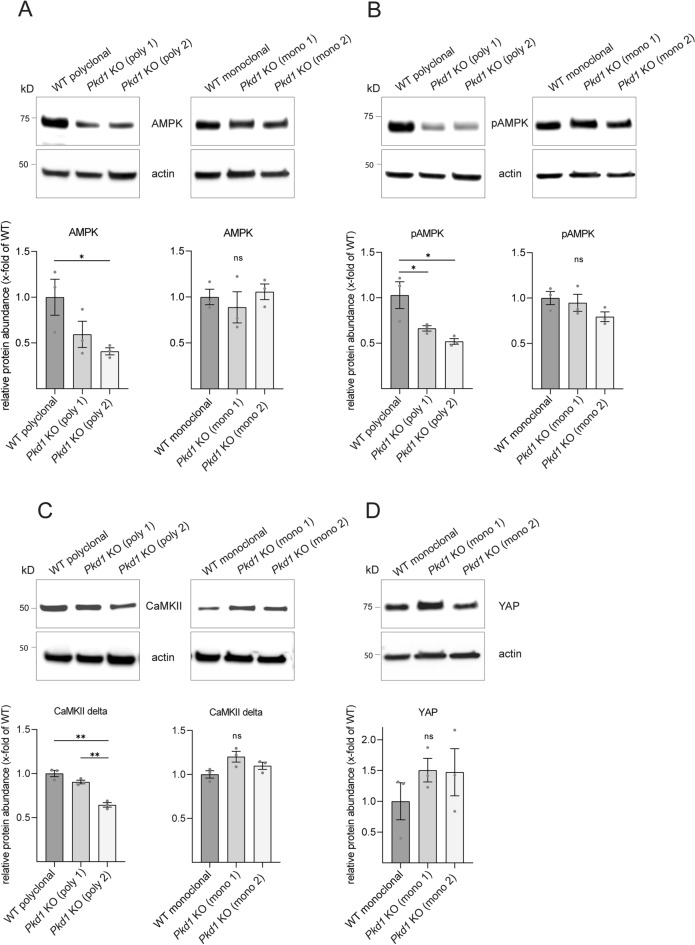
Figure 3.
Variability of protein levels for AMPK, pAMPK, CaMKII delta and YAP is reduced in monoclonal compared to polyclonal Pkd1 knockout clones (A) Protein abundance of AMPK is significantly reduced in Pkd1 KO clone 2 compared to polyclonal WT control. Monoclonal Pkd1 KO clones show no significant differences in protein abundance of AMPK compared to monoclonal WT control. (B) Protein abundance of pAMPK is significantly reduced in both polyclonal Pkd1 KO clones compared to polyclonal WT control. Monoclonal Pkd1 KO clones show no significant differences compared to isogenic WT control. (C) Protein abundance of CaMKII delta is significantly reduced in Pkd1 KO clone 2 compared to polyclonal WT control and Pkd1 KO clone 1. Monoclonal Pkd1 KO clones show no significant differences compared to isogenic WT control. (D) Monoclonal Pkd1 KO clones show no significant differences in protein abundance of YAP compared to isogenic WT control. Polyclonal setting is illustrated in Fig. 1. Three independent experiments were included in each analysis of protein levels. Error bars represent SEM. Statistical significance was evaluated using unpaired t-test. *Indicates p < 0.05. **Indicates p < 0.01. ***Indicates p < 0.001. ns means non-significant. Unprocessed blots for (A–D) are presented in Supplementary Figs. S8, S9, S10, and S11.

