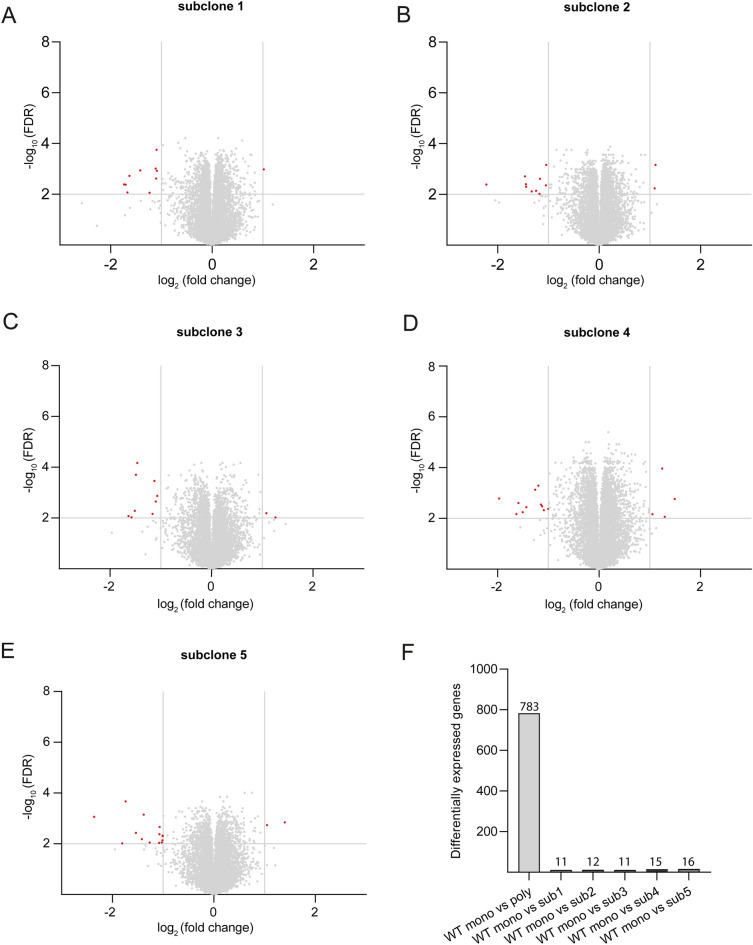
Figure 5.
Monoclonal wild-type cell line and corresponding subclones show similar transcriptomic profiles in contrast to the polyclonal wild-type. Volcano plots with differentially expressed genes in five different subclone cell lines of the parental monoclonal cell line in comparison with the parental monoclonal cell line (A–E). A bar chart (F) summarizes total amount of differentially expressed genes comparing parental cell line with polyclonal wild-type cell line as well as subclones with parental cell line. Threshold for false discovery rate (FDR) was set to log10 ≥ 2. Threshold for fold change was set to log2 ± 1. Grey dots represent genes which do not meet threshold criteria (FDR log10 < 2 and/or log2 (fold change) between ± 1).

