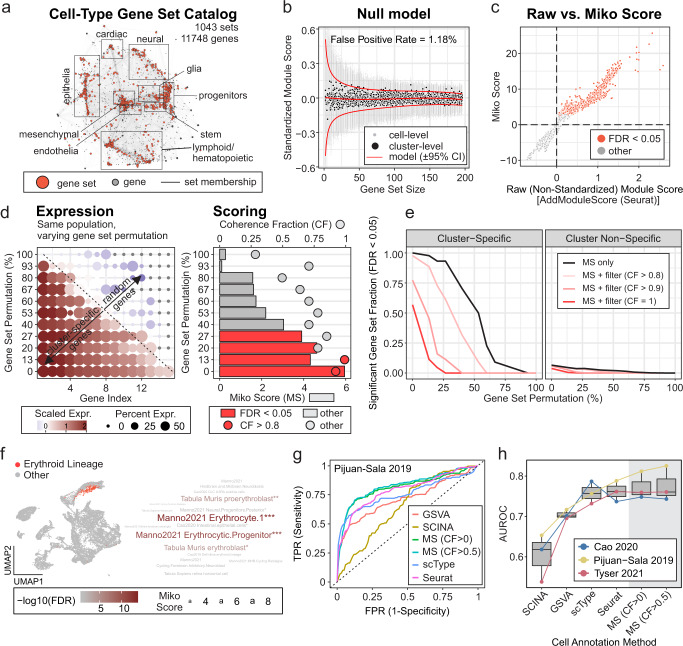
Fig. 4. Cell-type annotation.
a Cell-type-specific gene set catalog represented as bipartite network. Edges between gene sets (red nodes) and genes (gray nodes) represent gene set membership. Major cell ontologies are annotated, and the corresponding gene sets can be accessed using the scMiko R package. b Representative null model relating gene set size and standardized module scores (SMS; for random gene sets). Red curves: predicted mean SMS ± 95% CI; black points: observed cluster-level mean SMS; gray points: observed cell-level SMS. c Relationship between cluster-level non-standardized module score (AddModuleScore, Seurat R package) and Miko score. Clusters with significant module activity (FDR < 0.05) are indicated. d, e Evaluation of Miko score performance. d Representative gene sets with varying rates of permutation (i.e., substitution of cluster-specific gene with random gene; left) and corresponding Miko scores (bar plot, right) with coherent fractions (dot plot, right). e Relationship between degree of gene set permutation and fraction of cluster- and cluster-non-specific gene sets with significant (FDR < 0.05) module activity. Coherent fraction (CF) filters were included to demonstrate capacity to titrate score sensitivities and specificities. f Representative example of Miko score applied to murine gastrulation data21 using cell-type gene set catalog (a). UMAP illustrates cell population with curated cell-type of interest (erythroid lineage), and word cloud represents top cell types predicted by the Miko scoring algorithm. g Receiver operating characteristic (ROC) analysis illustrating cell annotation performance of marker-based scoring algorithms applied to murine gastrulation atlas21. h Cell annotation performance of Miko Scoring compared to existing marker-based scoring algorithms. Boxplots illustrate area under receiver operating characteristic (AUROC) curves across different methods and data sets. Methods were rank ordered by average AUROC performance.

