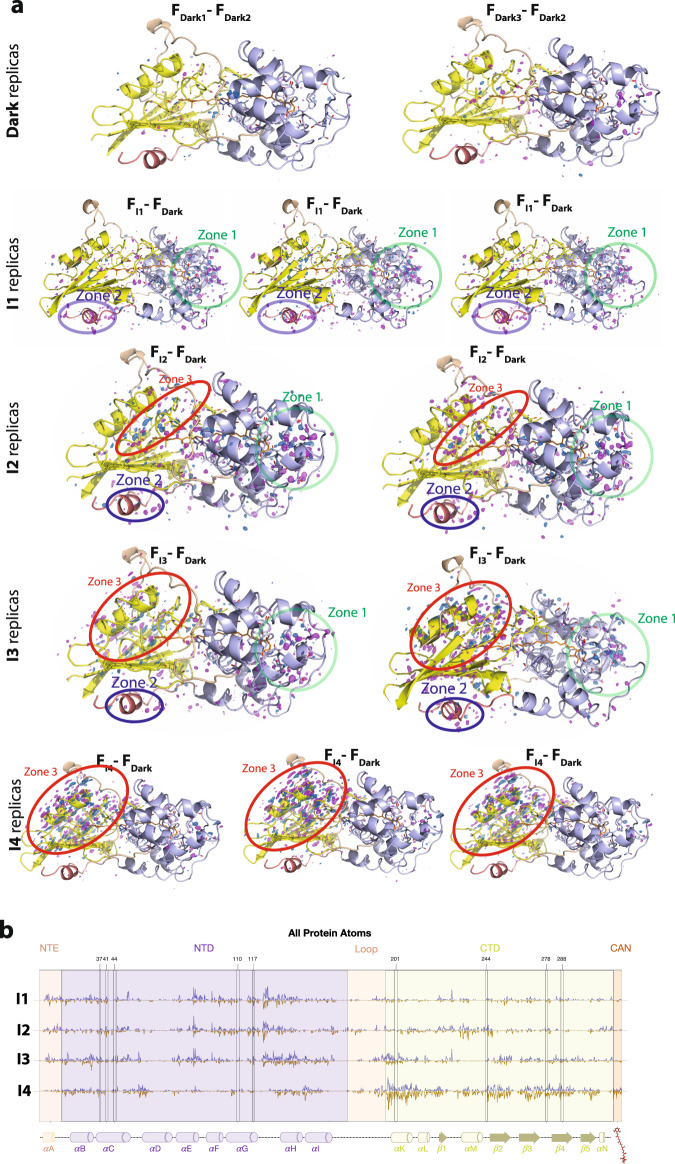
Fig. 3. DED signals in different states.
a DED maps contoured at ±3.5σ (blue and magenta correspond to the appearance and disappearance of density, contoured at 3.5σ). Dark state DED signals contoured at (±)3.5σ. The FDark1–FDark2 and FDark3–FDark2 exhibit marginal DED signals. The FI1–FDark, FI2–FDark, FI3–FDark, and FI4–FDark datasets show reproducible strong DED signals in the three different zones. The following domains undergoing photoinduced conformational changes are represented in oval shapes: Zones 1 (NTD), Zones 2 (NTE), and Zones 3 (Alpha-helices in CTD). b Difference electron density amplitudes calculated as described in the X-ray data refinement section of the “Methods”.

