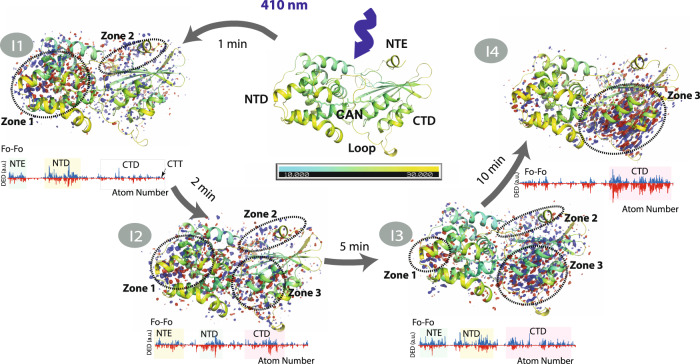
Fig. 5. Overall structural effect of illumination on OCP structure.
Datasets from which all images are derived (Dark, I1–I4) have a resolution of 1.3–1.4 Å (Supplementary Table 1) and time points at which crystals were cryo-trapped are indicated for I1–I4. Each structure is coloured in cyan-yellow gradient based on B-factor (10.0 (cyan)-30.0 (yellow)). (I1- I4, upper panel) F0 – F0 Difference electron density (DED) maps (blue/red at ±3.5σ) for the four states are shown below each corresponding structure: (I1) 1 min (FI1 – FDark), (I2) 2 min (FI2 – FDark), (I3) 5 min (FI3 – FDark) and (I4) 10 min (FI4 – FDark). The DED signals are localized in the three major areas: zone 1: NTD; zone 2: NTE; zone 3: alpha-helices in CTD. Note that some DED signals are observed at the interface between the two domains (red arrows in I1 and I2), while the C-terminal tail (CTT) does not exhibit any noticeable DED signal. Red: negative DED, blue: positive DED on the −3.5σ/3.5σ contour levels, respectively. See main text for further explanation. (I1–I4, lower panel) DED signals are also shown as integrated signals53 around each atom in the protein chain. The figure was created using PyMOL Molecular Graphics System (Version 2.5.0).

