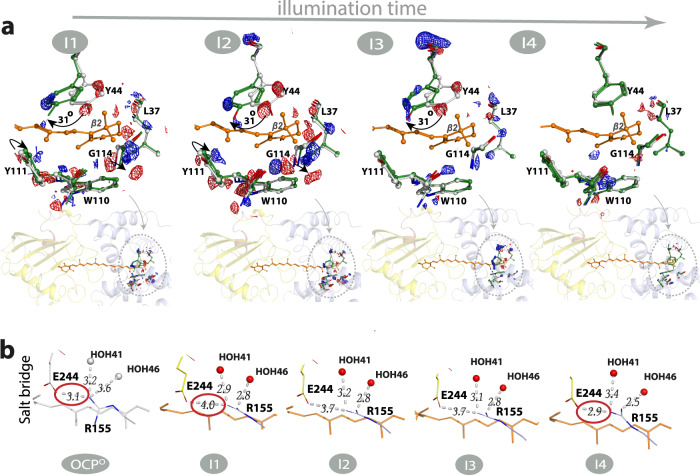
Fig. 6. OCP structural changes in I1–I4 states upon illumination.
a Dark (OCPO) coordinates are represented by grey sticks while light state coordinates obtained from extrapolated maps (I1–I4) are represented by green (NTD) and orange (CAN) sticks. Difference electron density (DED) FLight – FDark are shown with blue/red mesh at ±3.0σ). b Changes in the salt bridge formed between residues E244 and R155. The figure was created using PyMOL Molecular Graphics System (Version 2.5.0).

