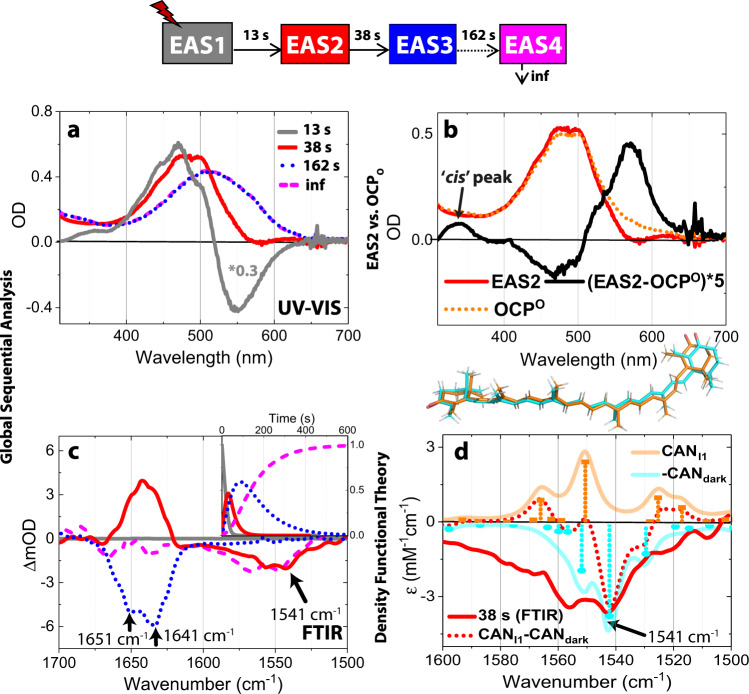
Fig. 8. Spectroscopic evidence for bicycle pedal isomerization in OCP in solution.
Results of the simultaneous global fit of UV–VIS (a) and FTIR (c) data upon 10 min of illumination. The kinetic model used for the fit is shown on top of the panel with the respective lifetime for each transition between intermediates. The same colour code is used for the corresponding EAS components in panels (a and c). Refer to the main text for an explanation of the relationship between the resolved EAS and the illuminated structural intermediates I1–I4 (Figs. 1c, 6). a UV–VIS EAS. For EAS1 spectrum multiplication a factor of 0.3 was used. b EAS2 component was compared to the original OCPO spectrum. c FTIR EAS (in D2O); FTIR (in H2O) is shown in Supplementary Fig. 1f. Insert: Relative concentration profiles for each EAS. d Theoretical IR frequencies and intensities were calculated using harmonic frequency calculations (HFC) at the B3LYP/6-311+G level. IR values were calculated for CAN in the two (CANDark and CANI1) states using CAN coordinates extracted from the extrapolated maps. Theoretical IR frequencies and calculated FTIR spectra are presented by sticks and solid lines respectively. Optimized CAN coordinates from HFC are shown on top of the panel. CANI1-CANDark (red dotted line) obtained from HFC agree with the 1542 cm−1 bleach from the 38-s EAS2 (red solid line). Source data are provided as a Source Data file.

